
FIGURE 3.
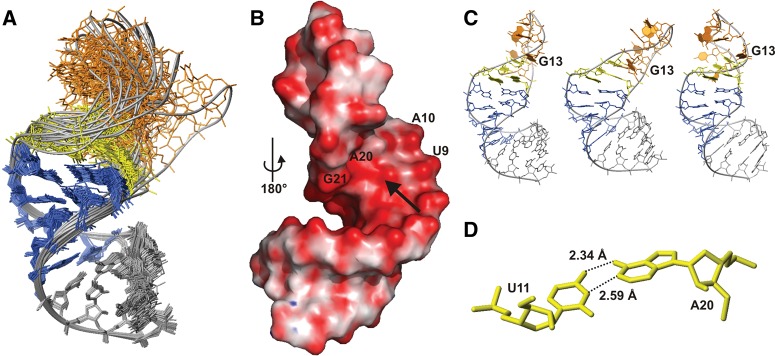
NMR structure of d3′EBS1. (A) Superposition of all heavy atoms in the stem (nucleotides 1–9 and 21–29) of d3′-EBS1 of the 20 lowest-energy structures. The coloring scheme corresponds to that of the secondary structure in Figure 1B. (B) Calculated surface potential of d3′EBS1. (Red) Negative (−682 mV) and (blue) positive (25 mV) potential. d3′EBS1 is turned by 180° with respect to A, thus showing the high density in negative potential on the major groove side at A20 and A10 marked by an arrow. (C) Three of the 20 lowest-energy structures showing possible orientations of the loop. (D) The relative orientation of U11 and A20 observed in some of the 20 lowest-energy conformers allows for hydrogen-bond formation between the two bases.