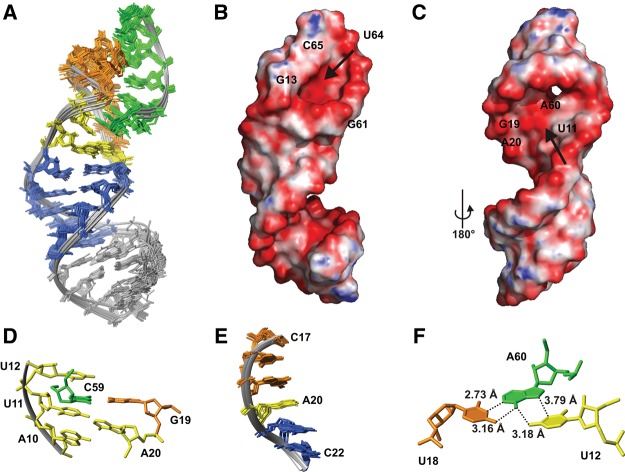
FIGURE 6.
NMR structure of d3′EBS1•IBS1. (A) Superposition of all heavy atoms in d3′EBS1•IBS1 of the 20 lowest-energy structures. The coloring scheme corresponds to that of the secondary structures in Figure 1C. (B,C) Calculated surface potential of d3′EBS1•IBS1. (Red) Negative (−642 mV), and (blue) positive (103 mV) potential. (Arrows) A high negative charge density (B) in the EBS1•IBS1 major groove and (C) near the 5′ end of IBS1 and the single-stranded nucleotides A20 and A10. (D) Section of d3′EBS1•IBS1 showing C59 (green) of IBS1 embedded between G19 (orange) of EBS1 and the unpaired nucleotides A10, U11, U12, and A20. The coloring scheme corresponds to that of the secondary structure in Figure 1C. (E) Superposition of nucleotides C17–C22 of the 10 lowest-energy structures of d3′-EBS1•IBS1 illustrating stacking interactions between G19, A20, and G21. (F) The orientation of U12, U18, and A60 is shown illustrating the putative major-groove triple base pair.

