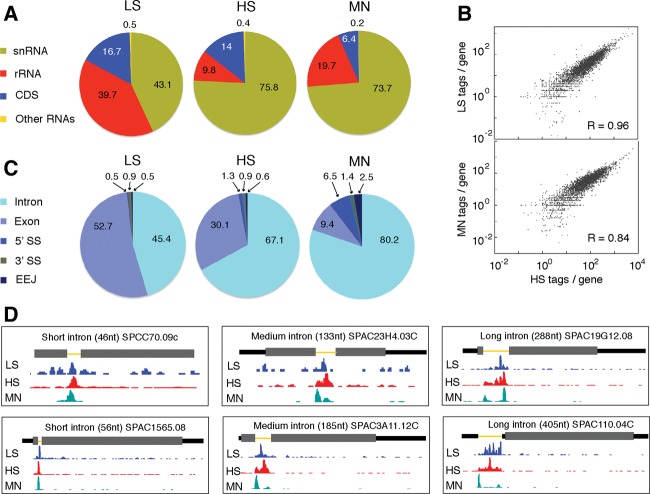
FIGURE 4.
RNAseq data for LS, HS, and MN endogenous U2·U5·U6 complex preps. (A) Pie charts showing class distributions of transcript mapping reads for LS (left), HS (middle), and MN (right) libraries. The “Other RNAs” class includes snoRNAs, tRNAs, misc-RNAs, and long terminal repeats (LTRs). (B) Log2 plots of tag abundance per CDS gene reveal excellent correlations between LS, MN, and HS libraries. (C) Pie charts showing distributions of intron, exon, 5′SS, 3′SS, and exon-exon junction mapping reads among the LS (left), HS (middle), and MN (right) libraries. (D) Two examples each of genes with a short (left: 46 and 56 nt), medium length (middle: 133 and 185 nt), or long (right: 288 and 405 nt) intron showing coverage of LS, HS, and MN tags along the gene. Thick gray rectangles: coding regions; medium black lines: UTRs; thin yellow lines: introns. Consistent with the pie chart in C, the LS library contains the most exon-mapping reads, whereas MN reads are almost exclusively confined to introns. Note the single MN peak on short introns and double MN peaks on medium length and long introns.

