
FIGURE 5.
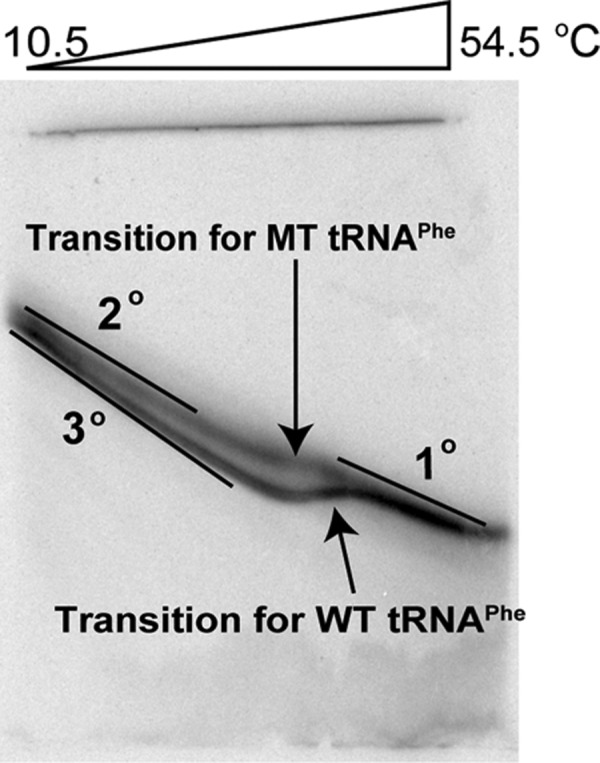
Perpendicular TGGE plot for WT and MT tRNAPhe melting transitions. Electrophoresis is 13% PAGE and 1× THEN10M0.9 (pH 7.5) (= 33 mM Tris, 66 mM HEPES, 0.1 mM EDTA, 10 mM NaCl, 0.9 mM MgCl2) and 4 M urea (to facilitate melting in the TGGE range). Baselines slant to the bottom right-hand corner owing to the temperature gradient, which was also observed in the blue tracking dyes (data not shown).