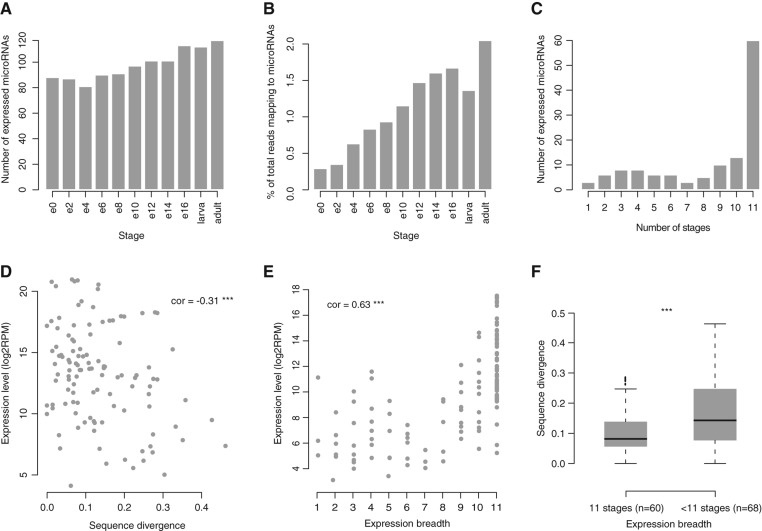
FIGURE 2.
MicroRNA expression in D. virilis small RNA libraries. Samples include nine embryonic stages: 0- to 2-h embryo (e0), 2- to 4-h embryo (e2), etc., 16- to 30-h embryo (e16), larvae and adults. (A) Number of individual microRNAs detected in each library. (B) Percentage of reads mapping to microRNAs with respect to the total number of reads mapping to the genome in each library. (C) MicroRNA expression breadth. Graph shows the numbers of microRNAs expressed in a number of developmental stages from 1 (single stage) to 11 (all stages). (D) Scatter plot of the relationship of summed microRNA expression level in all libraries and microRNA hairpin sequence divergence. (E) Scatter plot of the relationship of summed microRNA expression levels and microRNA expression breadth. Pearson's product-moment correlation value is shown in the body of D and E. (***) P < 0.001. (F) Box plot of microRNA hairpin sequence divergence of microRNAs expressed at all developmental stages (11 stages) and microRNAs expressed at fewer developmental stages (<11 stages). Mean values are significantly different [Student's t-test; (***) P < 0.001].

