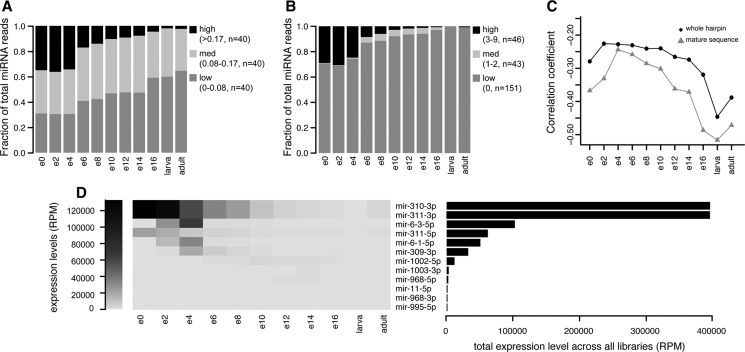
FIGURE 3.
Expression patterns of microRNAs of different evolutionary rates throughout the development of D. virilis. Stages are labeled as follows: 0- to 2-h embryo (e0), 2- to 4-h embryo (e2), etc., 16- to 30-h embryo (e16), larvae, and adults. (A,B) MicroRNAs hairpins (A) and mature microRNA sequences (B) were divided into three groups depending on the substitution rates between D. melanogaster and D. virilis. Bars represent the relative expression levels of the microRNAs from each group (with low substitution rates, medium substitution rates, and high substitution rates) at each stage of development. The number of microRNAs and the sequence divergence range for each bin is shown in the legend. Note that different arms of the same hairpin are treated separately in B. (C) Correlation of microRNA evolutionary rates at the level of the whole hairpin and the mature sequences and microRNA expression levels throughout development. Vertical axes represent Spearman's correlation coefficient (ρ) obtained for each stage; values are statistically significant (P < 0.05). (D) Expression levels and patterns of individual mature microRNAs with three or more substitutions in their sequence between D. melanogaster and D. virilis. The heat map on the left shows the expression levels of the microRNA from this group throughout development, and the bar graph on the right reflects the total expression level of each microRNA in all libraries. MicroRNAs are sorted by their total expression levels across all libraries, and microRNAs with negligible total expression levels of below 1000 RPM are not shown.

