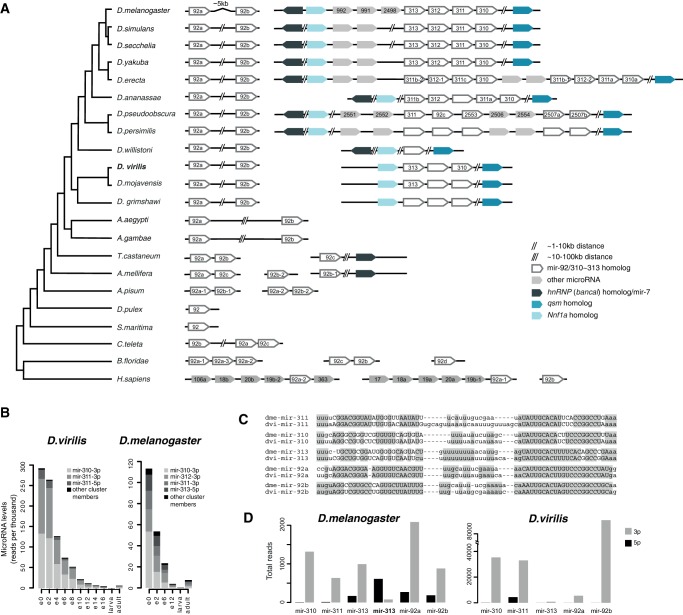
FIGURE 4.
Evolution and expression of the mir-310∼313 cluster members. (A) Schematic diagram of the evolutionary history of the extended mir-92/mir-310 family. Individual chromosomes or scaffolds and presented with a black line and oriented in the direction of the corresponding microRNA transcript(s). MicroRNAs annotated in miRBase are labeled, while homologs found by BLAST/INFERNAL searches are blank. Homologs of flanking protein-coding genes are shown as colored blocks. (B) Expression levels of the members of the mir-310∼313 cluster in small RNA libraries from different developmental stages of D. melanogaster and D. virilis. Horizontal axis labels are as in Figures 2 and 3. (C) Alignments of mir-310 family members in D. melanogaster and D. virilis. Mature arms are marked in uppercase and conserved sites between 1-to-1 orthologs are highlighted. (D) Total number of reads across experiments mapping to the 5′ and the 3′ arms of mir-310∼313 cluster members in D. melanogaster and D. virilis.

