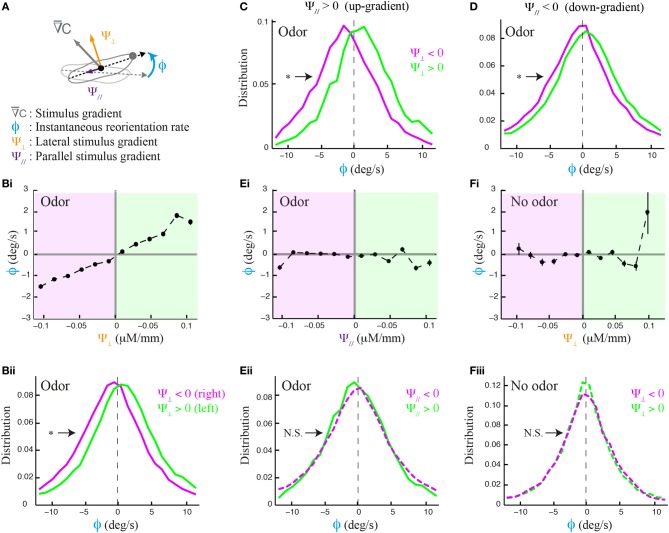
Figure 2.
Effects of lateral and translational stimulus gradients on the weathervane corrections of wild type larvae. (A) Illustration of the three main variables applied to characterize weathervaning: reorientation rate (ϕ) and projection of the local odor gradient on the axis tangent to the direction of motion (translational gradient, Ψ//) and projection perpendicular to the direction of motion (lateral gradient, Ψ⊥). All panels correspond to the behavior of wild type larvae. (Bi) Lateral gradient modulates run directionality both in sign and in strength (linear correlation: slope = 15.5, R2 = 0.975). Gradient values are represented in 12 bins of 0.02 μM/mm. (Bii) Distributions of reorientation rates during runs are shifted to the left or the right according to the direction of the lateral gradient. By convention, positive values point to the left (green) and negative values point to the right (magenta). Plain lines indicate statistically significant differences between 0 and the mean of the distribution (one-sample t-test, p < 0.001). The star indicates a significant difference between the means of the left and right distributions (two-sample t-test, p < 0.001). (C,D) Distributions of reorientation rates restricted to runs oriented up-gradient and down-gradient (positive and negative translational gradient, respectively). A stronger modulation of the reorientation rate through the lateral gradient is found for up-gradient runs. Same statistical representation as in (Bii). (Ei) In presence of odor, the local odor gradient parallel to the animal does not condition run directionality (slope of linear regression equal to −0.86, R2 = 0.043). (Eii) Reorientation rate distributions restricted to left and right lateral gradients are not significantly different from each other (two-sample t-test, p = 0.06), nor is the mean of the distribution different from 0 when the gradient points to the right (one-sample t-test, p = 0.2), although a statistically significant difference is found for the mean when the gradient points to the left (one-sample t-test, p = 0.001). (Fi) Control condition in absence of odor shows no modulation of the lateral gradient (slope of linear regression equal to 3.0, R2 = 0.089). (Fii) Reorientation distributions are not significantly different from zero (one-sample t-test, p > 0.12), neither is the difference between their means (two-sample t-test, p > 0.8) indicating that the asymmetric modulation of individual runs is caused by the sensory gradient. In (Bi,Ei,Fi), the average reorientation rates are calculated from bins including between Nmin = 247 and Nmax = 7490 data points.

