
Figure 7.
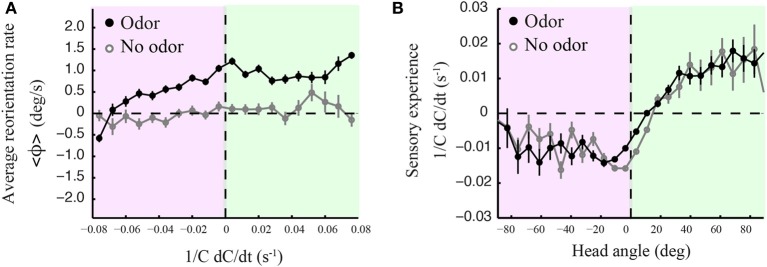
Curved runs, head casts and olfactory experience. (A) Averaged instantaneous reorientation rate (ϕ) as a function of the sensory experience measured at the head (1/C dC/dt). Here positive and negative signs of reorientation rates imply reorienting toward and away from the gradient, respectively. The black line corresponds to wild type larvae tested in presence of odor. The light gray line corresponds to the no-odor control carried out with wild type. In the presence of odor, the signed average reorientation rate is positive nearly throughout the range of sensory experience, whether the instantaneous stimulus concentration derivative at the head is positive (green quadrant) or negative (red quadrant). (B) Averaged sensory experience as a function of the signed head angle where positive angles point toward the local gradient, as for the reorientation rate of (A). Negative sensory experiences are obtained when the head points away from the gradient. However, straight postures and small positive head angles correspond to negative sensory experiences (both in the presence and absence of odor), suggesting that motion tends to bring the larva away from the position of the odor source, which leads to an average decrease in odor concentration. In (A,B), error bars represent s.e.m. The distributions arise from N = 1236 runs for the odor condition and N = 210 runs for the no-odor control. In (A), averages are calculated from bins of 0.008 s−1 including between Nmin= 273 and Nmax = 3519 data points. In (B), averages are calculated from bins of 7.2° including between Nmin = 106 and Nmax = 11169 data points.