
Figure 1.
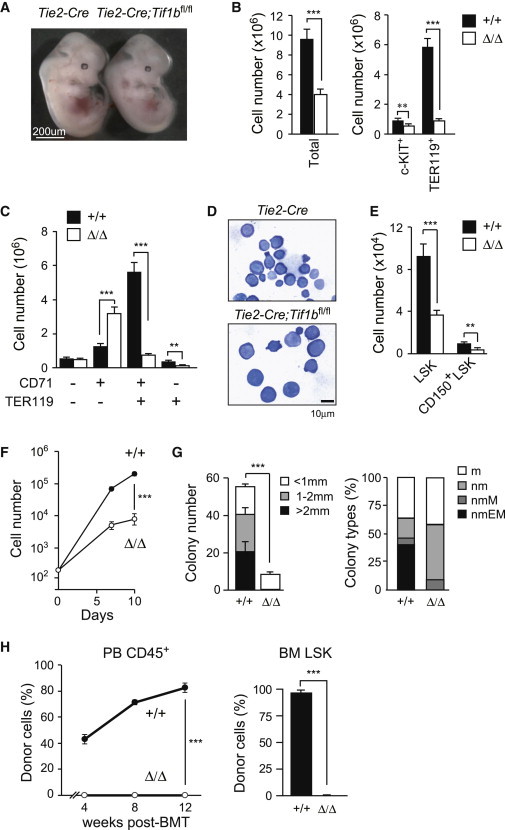
Tie2-Cre;Tif1bfl/fl Embryos Die at Midgestation
(A) Appearance of Tie2-Cre (Tif1b+/+) and Tie2-Cre;Tif1bfl/fl (Tif1bΔ/Δ) embryos at E13.5.
(B) Absolute numbers of whole fetal liver cells, c-KIT+ progenitors, and TER119+ erythroblasts at E13.5. The data are shown as mean ± SEM (Tie2-Cre, n = 16; Tie2-Cre;Tif1bfl/fl, n = 17).
(C) Absolute numbers of erythroid cells at different stages defined by CD71 and TER119 expression in fetal livers at E13.5. The data are shown as mean ± SEM (Tie2-Cre, n = 16; Tie2-Cre;Tif1bfl/fl, n = 17).
(D) Morphology of Tif1b+/+ and Tif1bΔ/Δ fetal liver hematopoietic cells from E13.5 embryos stained with May-Grünwald-Giemsa solution.
(E) Absolute cell numbers of LSK and CD150+LSK cells in the fetal liver at E13.5. The data are shown as mean ± SEM (Tie2-Cre, n = 23; Tie2-Cre;Tif1bfl/fl, n = 21).
(F) Growth of Tif1b+/+ and Tif1bΔ/Δ LSK cells from E13.5 fetal livers in liquid culture in the presence of 50 ng/ml of SCF and TPO. The data are shown as mean ± SEM for triplicate cultures.
(G) Colony-forming assays with Tif1b+/+ and Tif1bΔ/Δ fetal liver cells. Left panel shows the absolute number of colonies with the indicated size per 20,000 fetal liver cells. The data are shown as mean ± SEM for triplicate cultures. Right panel shows the proportion of colony types defined by the composition of colony-forming cells (n, neutrophil; m, macrophage; E, erythroblast; M, megakaryocyte).
(H) Competitive repopulating assays. A total of 2 × 10⁵Tif1b+/+ and Tif1bΔ/Δ fetal liver cells from E13.5 embryos (CD45.2) mixed with the same number of competitor BM cells (CD45.1) were transplanted into CD45.1 recipients. Chimerism of donor-derived CD45.2+ cells in the PB is shown in the left panel. Donor chimerism in the BM LSK cells at 12 weeks posttransplantation is shown in the right panel. The data are shown as mean ± SEM (n = 6). ∗p < 0.05; ∗∗p < 0.005; ∗∗∗p < 0.0005.