
Figure 3.
Derepression of Nonhematopoietic Genes in Tif1b-Deficient LSK Cells
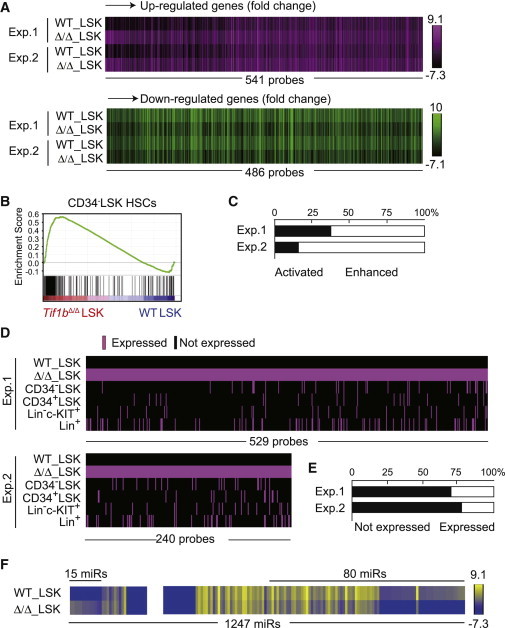
(A) Heatmap of the expression of genes that were upregulated (541 probe sets, upper panel) or downregulated (486 probe sets, lower panel) more than 2-fold in Tif1b-deficient BM LSK cells in the microarray analysis.
(B) GSEA of the gene set specific to CD34−LSK HSCs in Tif1bΔ/Δ LSK cells. Using the microarray data from CD34−LSK HSCs, CD34+LSK MPPs, Lin−c-KIT+ committed progenitors, and Lin+ differentiated cells, HSC-specific gene sets were selected and applied to GSEA.
(C) Upregulated genes in (A) were divided into two groups according to their expression levels in Tif1bΔ/Δ LSK cells compared to that in control LSK cells. One group consist of probe sets that were expressed in the control LSK cells and their expression levels were enhanced upon deletion of Tif1b (“enhanced” genes). The other group includes probe sets that were not expressed in the control LSK cells but became activated in Tif1b-deficient LSK cells (“activated” genes). Bar graph shows proportions of these groups.
(D) Schematic representation of expression profiles of “Activated” genes in BM Tif1b-deficient LSK cells in (A) in various hematopoietic cell fractions, including CD34−LSK HSCs, CD34+LSK MPPs, Lin−c-KIT+ committed progenitors, and Lin+ differentiated cells. Expressed genes are depicted as a red bar.
(E) Proportions of probe sets in (D) that were not expressed in any of the hematopoietic cell fractions (Not expressed) and those expressed in at least one of the hematopoietic cell fractions including CD34−LSK HSCs, CD34+LSK MPPs, Lin−c-KIT+ committed progenitors and Lin+ differentiated cells (Expressed).
(F) Heatmap of the expression of miRNAs that were upregulated (15 miRs) or downregulated (80 miRs) more than 2-fold in Tif1b-deficient BM LSK cells in the microarray analysis.