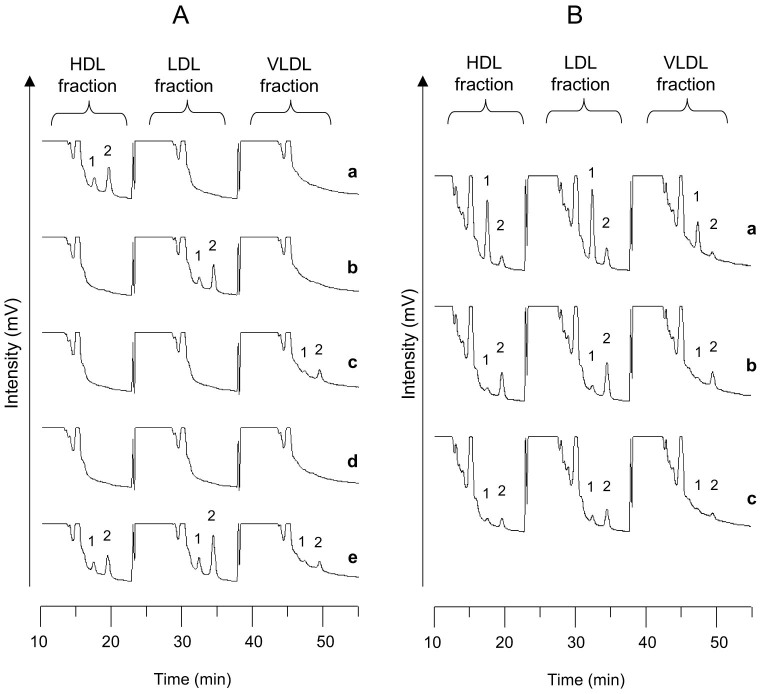
Figure 2. Chromatograms of HDL, LDL, VLDL, bottom fraction and plasmas spiked with γ- and α-tocopherols.
(A). The chromatograms a, b, c, and d are the fractions of HDL (1.063 < density < 1.210 g/mL), LDL (1.019 < density < 1.063 g/mL), VLDL (density < 1.019 g/mL, and flotation rate 200–400 in a solution of 1.745 mol/L sodium chloride), and bottom fraction (1.210 g/mL < density). The chromatogram e is plasma (Subject1, male, age 46, total cholesterol = 5.22 mmol/L, triglyceride = 0.86 mmol/L). (B). The chromatograms a, b, c are plasma samples spiked with γ- and α-tocopherol and original plasma (Subject1), respectively. The samples for b or c are mixture (1:1) of the original plasma and γ- or α-tocopherol solution, 0.06 mmol/L, respectively.

