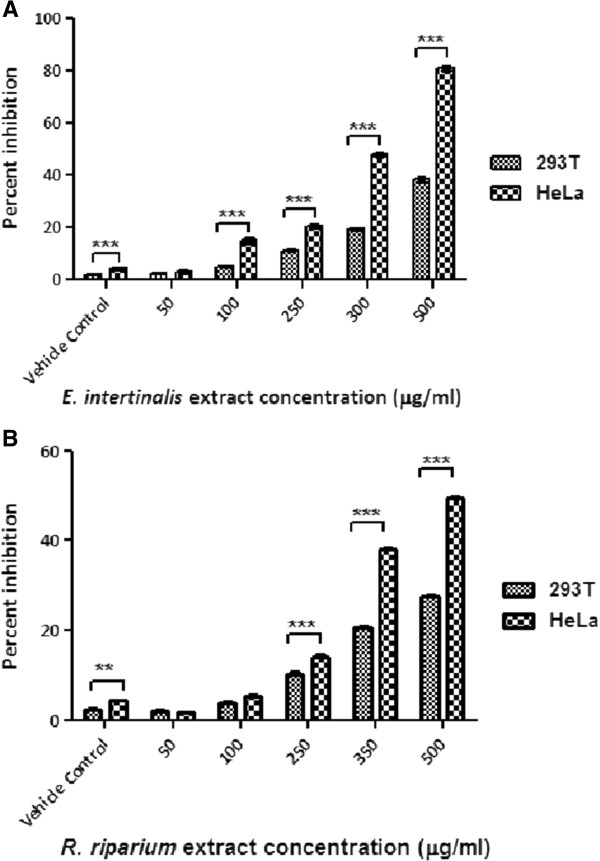
Figure 1.
Histograms showing the antiproliferative effects of the AMEs on HeLa and 293 T cell lines. The cells were treated with increasing concentration of AMEs for 24 hours. Cytotoxicity of the AMEs was evaluated by MTT assay. Results showed percent inhibition of cell growth against increasing concentration of the extracts. (A) E. intestinalis extract treated, (B) R. riparium extract treated.Columns with bars represent mean ± SE of triplicates. Percent inhibitions of the AMES at each concentration point were compared between the two cells lines. According to the significance levels found, they were further categorized using various symbols as follows, **: p < 0.01; ***: p < 0.001.

