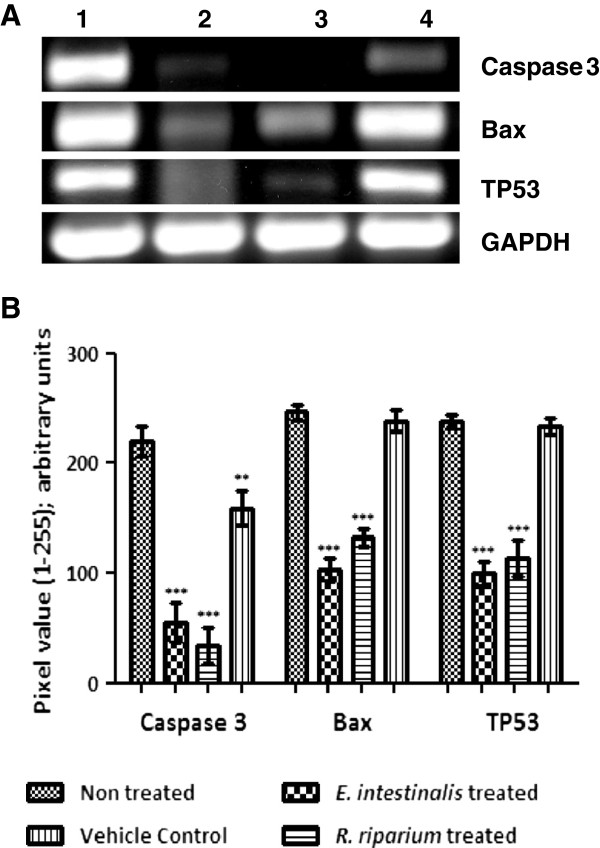
Figure 6.
Gene expression profiles of Caspase 3, Bax, TP53, GAPDH in HeLa cells treated with AMEs (IC50 doses) by semi quantitative RT-PCR. (A) Representative pictures of three independent experiments. Lane 1) Non-treated, Lane 2) E. intestinalis extract treated, Lane 3) R. riparium treated, 4) Vehicle control. (B) Relative levels of gene expressions after normalization for GAPDH were determined by densitometry analysis of the bands, represented by histogram. Columns with bars represent mean ± SE of triplicate pixel values for the bands. Intensity for each band in the treated sets was compared with that of in non treated sets. According to the significance levels found, they were further categorized using various symbols as follows, **: p < 0.01; ***: p < 0.001.

