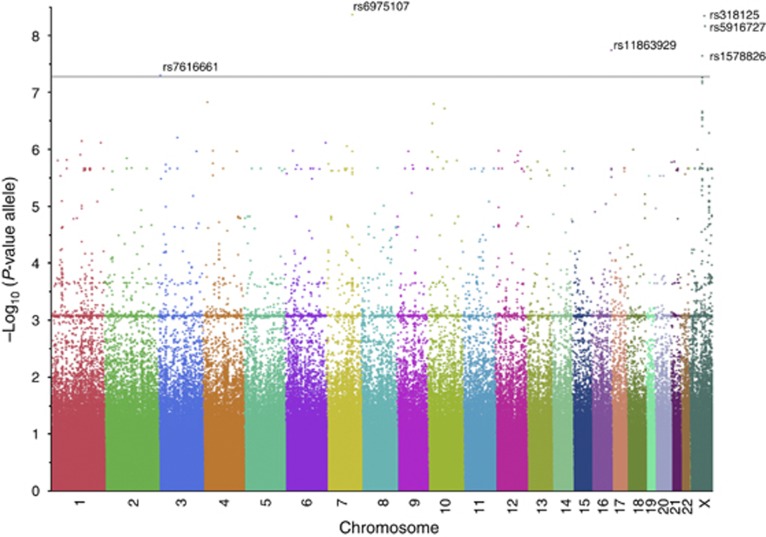
Figure 1.
Manhattan plot shows that single-nucleotide polymorphisms (SNPs) are distributed across all chromosomes in the discovery group with significant SNPs labeled. Results are plotted as negative log10-transformed P-values from a genotypic association test using allele mode. Significant SNPs are shown in Table 2.

