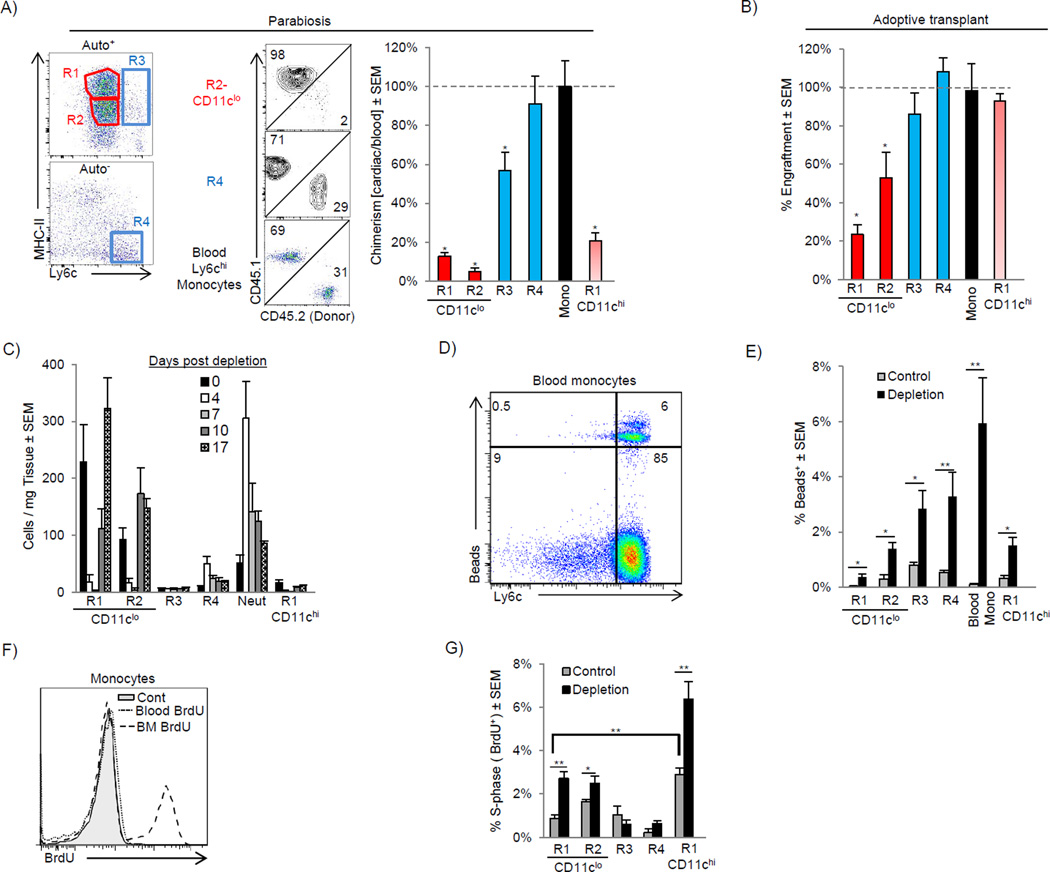
Figure 2. Distinct mechanisms regulate cardiac macrophage turnover in steady and following the disruption of homeostasis.
A) CD45.1 and CD45.2 mice were surgically joined to create parabiotic mice and were analyzed after 2 weeks. Dot plots show rate of chimerism for representative populations. The percentage chimerism for each cardiac monocyte and macrophage subset was normalized for the chimeric rate for blood monocytes and expressed as a percentage. B) E14.5 Fetal liver CD150+ HSCs were sorted and adoptively transplanted into sublethally irradiated mice. 16 weeks after transplant, mice were harvested and engraftment of transplanted cells was assessed in blood monocytes and cardiac monocytes and macrophage populations. Engraftment for cardiac populations was normalized for blood monocyte engraftment. C–G) Mice were injected with either control liposomes (Control) or liposomes containing clodronate to deplete cardiac macrophages (Depletion) and analyzed over time (C). D–E) Ly6cHi blood monocytes were labeled with fluorescent microspheres in vivo after macrophage depletion (Tacke et al., 2006). D) Bead expression in SSCLowCD115+F4/80+ blood monocytes after macrophage depletion. E) Percentage of cardiac bead+ cells after depletion. F) To assess proliferation, mice were injected with BrdU and analyzed 2 hrs post injection. Proliferation (BrdU+) in Ly6chi monocytes in the bone marrow (BM) and blood is shown. G) Percentage of proliferating BrdU+ cells following macrophage depletion (7 days) within the myocardium in each subset. N=4–7, * P <0.05. ** P<0.01. Data represents at least two experiments, n= 6–12 mice per group.

