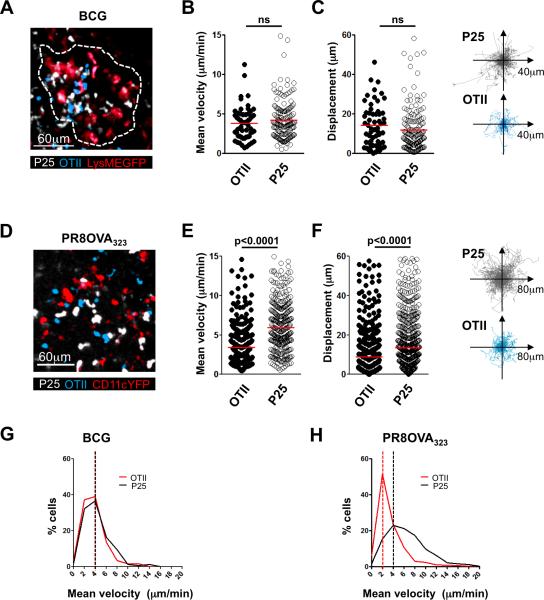
FIGURE 3.
Differences in CD4+ T cell effector function are mirrored by differences in dynamic behavior. A-C, Lung BCG granuloma image acquired by two-photon microscopy and analysis thereof. D-F, Image of inflammatory patch in an influenza-infected lung acquired by two-photon microscopy and analysis thereof. A and D, Maximum projection rendering of imaging volume. Colors of the words correspond to colors in the image, here and throughout. In panel A, the dotted line delineates the margins of the granuloma in the image. B and E, Mean velocity of OTIIs and P25s; red line indicates mean value. C and F, Total displacement over the duration of the imaging session (red line indicates mean value) and representation of the tracks of OTIIs and P25s over the duration of the movie, all translated to the same starting point. G and H, Frequency distribution of P25 and OTII velocities in BCG (G) and influenza-infected tissue (H); bin width of 2μm. Dashed lines indicate mode of the distributions. ns=non-significant. All data are representative of at least 3 similar experiments, with at least 3 mice per group. Statistics performed using the unpaired Student's t test.

