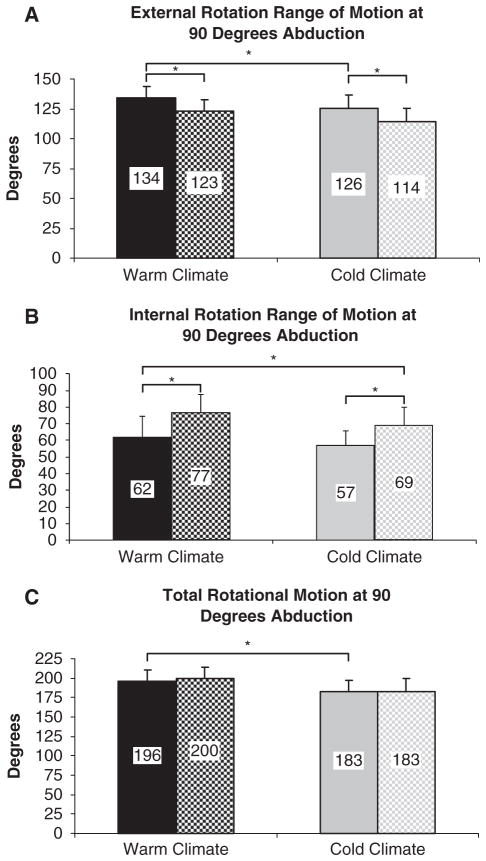
Figure 1.
Range of motion for athletes from the warm-weather (solid black, dominant; hashed black, nondominant) and cold-weather (solid gray, dominant; hashed gray, non-dominant) groups for external rotation (A), internal rotation (B), and total motion (C). Mean values are reported within the thick vertical bars; thin vertical bars represent the standard deviation. Statistical significance at P <.05 is denoted by an asterisk (*).

