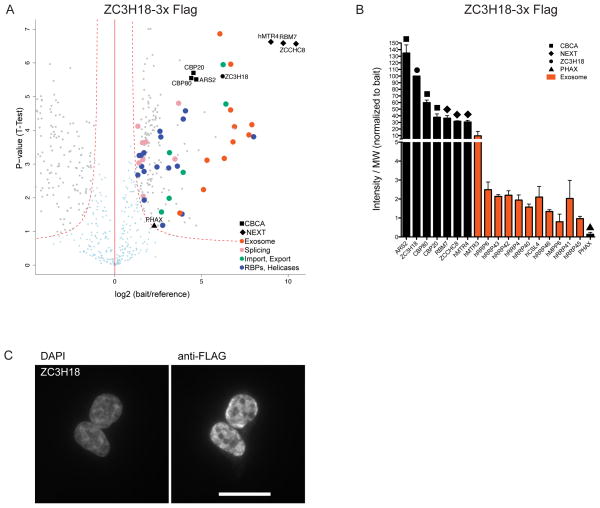
Figure 3.
AC of ZC3H18 identifies stoichiometric CBCN complex (a) Volcano plot displaying the result of triplicate ZC3H18-3xFLAG ACMS experiments plotted and labeled as in Fig. 1a. The full data set of specific co-precipitants is given in Supplementary Table 7. (b) Column chart displaying abundance of selected proteins from ZC3H18-3xFLAG AC eluates plotted and labeled as in Fig. 1b. (c) α-FLAG immunofluorescence microscopy analysis of HEK293 Flp-In T-Rex cells stably expressing ZC3H18-3xFLAG. DAPI stain is included as nuclear marker. Scale bar represents 50 μm.

