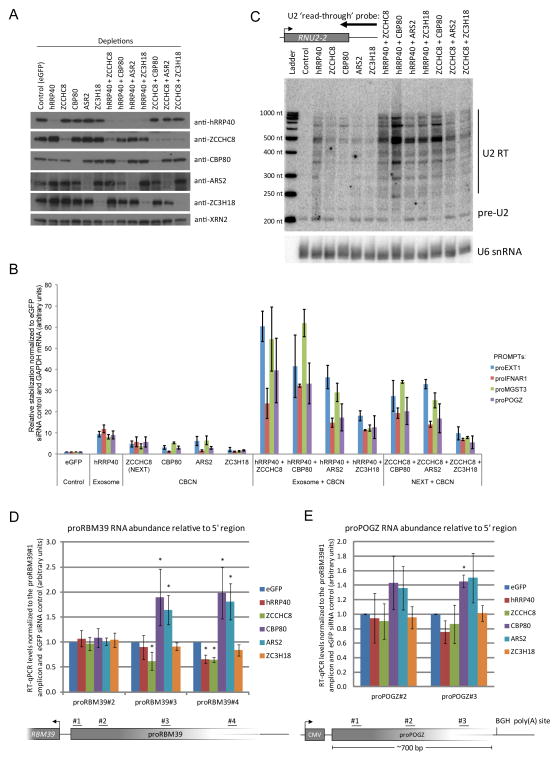
Figure 5.
Hyper-accumulation of PROMPTs upon co-depletion of CBCA with NEXT or RNA exosome complex components (a) Western blotting analysis showing protein depletion upon the indicated siRNA administrations. Anti-XRN2 antibody was used as loading control. (b) RT-qPCR analysis of total RNA from HeLa cells subjected to the indicated siRNA transfections and using amplicons for the indicated PROMPT regions (Supplementary Table 10). Data are displayed as mean values normalized to the control (eGFP siRNA) and normalized to GAPDH RNA as an internal control. Error bars represent standard deviations (n=3 biological replicates). (c) Stabilization of 3′-extended U2 RNA upon the indicated single- and co-depletions of CBCA, NEXT and exosome components as assessed by northern blotting analysis. Position of the utilized probe is shown at the top. U6 snRNA was probed as loading control. Detected RNA species and sizes of molecular ladder are displayed to the right and left of the blot, respectively. (d,e) Increased PROMPT ‘read-trough’ RNA levels upon CBP80 and ARS2 depletion. Ratios of proRBM39 (d) and proPOGZ (e) RNA levels relative to their 5′ends (RT-qPCR using amplicons positioned as displayed below the column charts). PROMPT levels relative to those derived from the 5′region are displayed normalized to the eGFP siRNA control. Error bars represent standard deviations (n=3 biological repeats). * P < 0.05 (two tailed one-sample t-test).

