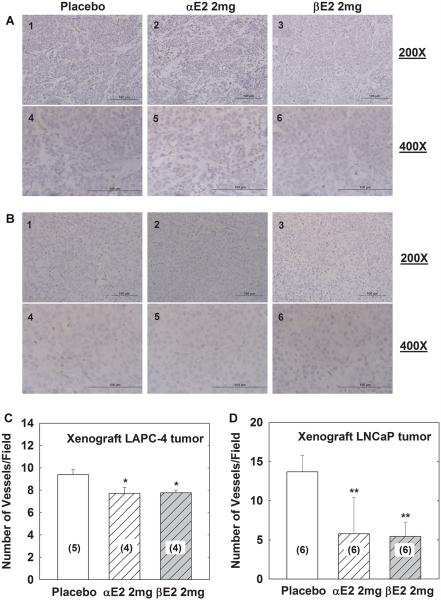
Fig. 5.
αE2 and βE2 decrease microvessel number in tumor tissues from xenograft animals with LAPC-4 or LNCaP prostate tumor. (A,B) show representative images in 200× and 400× magnification of CD31 immunohistochemistry of tumor tissues from xenograft animals with LAPC-4 or LNCaP prostatic tumor, respectively. The scale bar on the bottom of each image is 100 μm. The number of microvessels (MV) was quantitated as indicated in the Materials and Methods Section, and the data are presented as mean ± SEM in (C) and (D) for LAPC-4 and LNCaP xenograft tumor tissues, respectively. **P < 0.01 and *P < 0.05 compared to the corresponding placebo group. The number in the parenthesis is the sample size.

