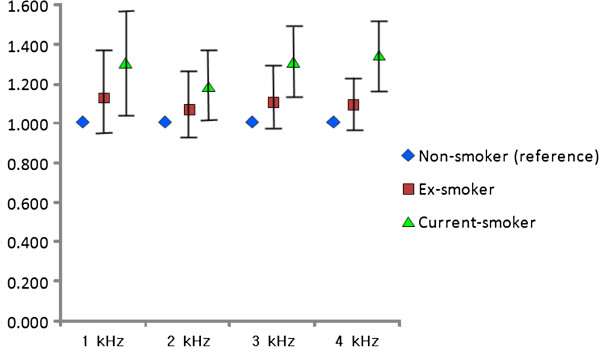
Figure 4.

Adjusted odds ratio of hearing loss by frequencies according to smoking status. * Dot: odds ratio (adjusted for age, working period, noise level, body mass index, mean arterial pressure, fasting blood glucose, total cholesterol, triglyceride, HDL cholesterol, hemoglobin), bar: 95% confidence interval according to smoking status.
