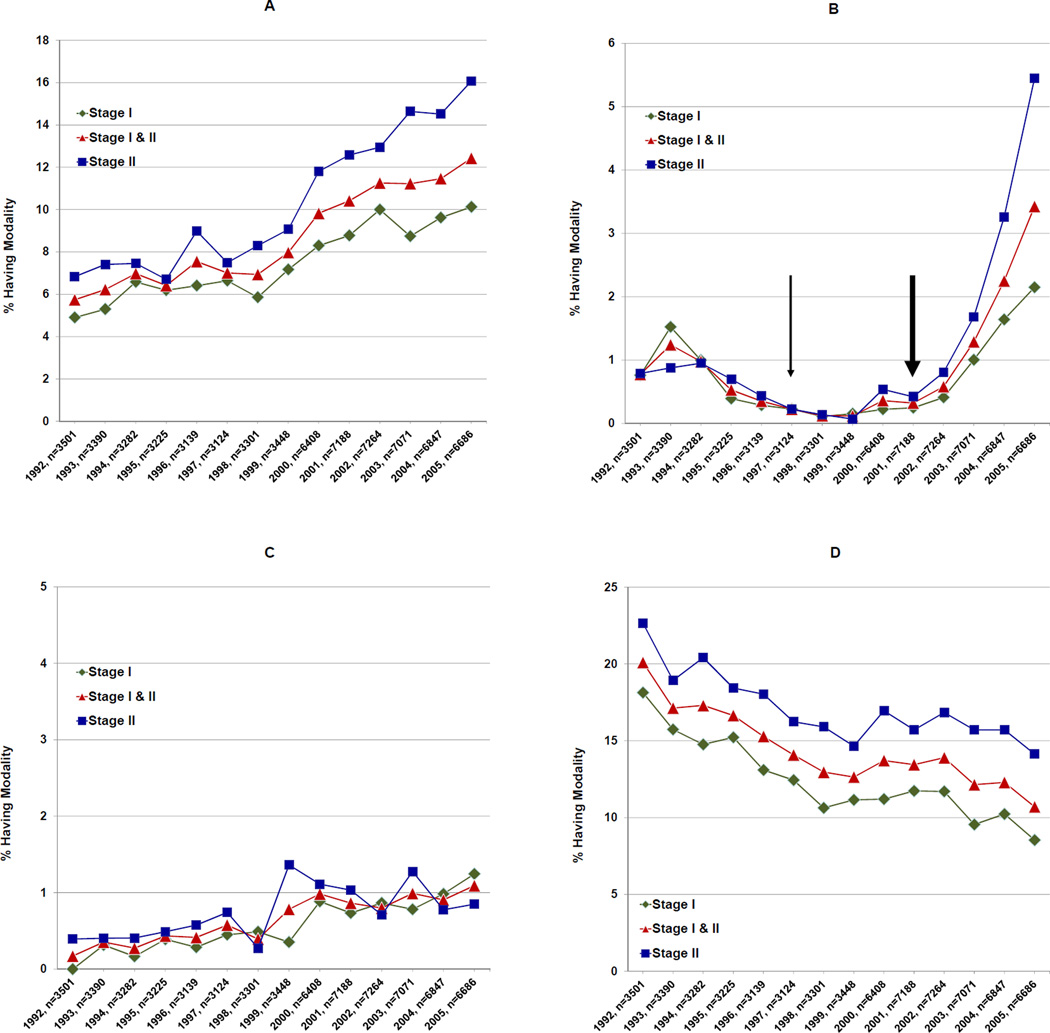
Figure 1.
Imaging trends from 1992 to 2005. Panels represent: (A) CT Scans, (B) PET Scans, (C) Brain MRIs, and (D) Bone Scans. In all panels, the x-axis represents the year and total number of sample patients having stage I and II breast cancer in that year. For panel (B), the thin arrow represents the year in which PET Scans were FDA approved for use in cancer patients, while the thick arrow represents the year in which PET scans were approved by Medicare for use in breast cancer patients specifically.

