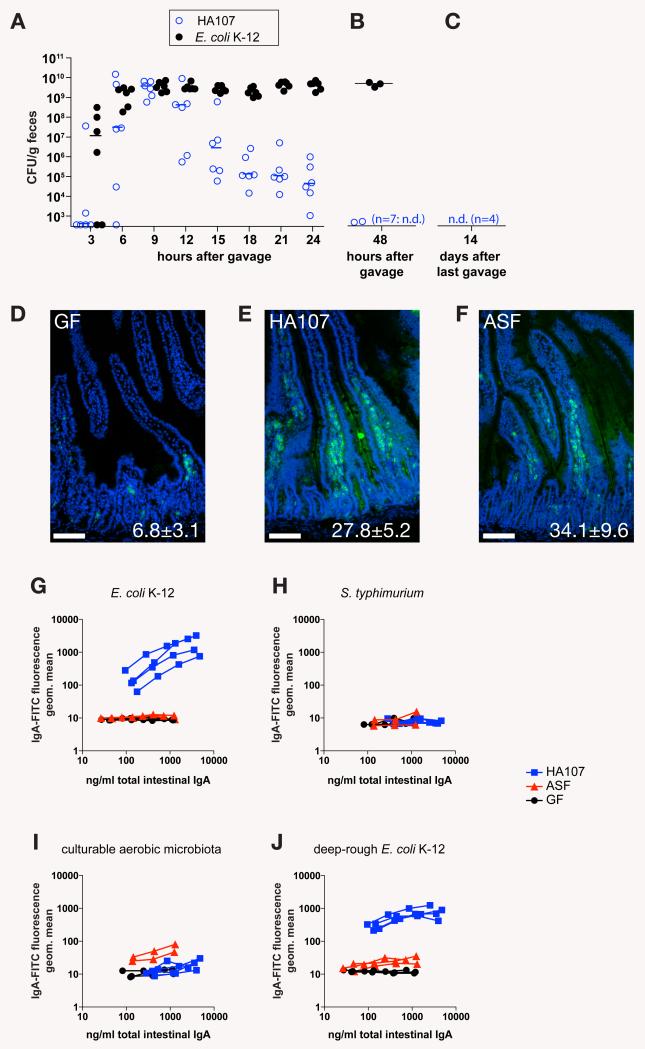
Fig. 1.
Reversible E. coli HA107 colonization induces specific mucosal IgA. (A) Germ-free Swiss-Webster mice were analyzed for fecal shedding of live E. coli by bacterial plating and enrichment culture in m-DAP- and D-Ala-supplemented media of fecal material at indicated times after gavage of 1010 CFU of HA107 (n=6) or wild type parent strain JM83 (E. coli K-12; n=6). Data points represent individual mice from one experiment. Bars indicate medians. (B) Germ-free SwissWebster mice treated as in (A) with HA107 (n=9) or E. coli K-12 (n=3) and analyzed after 48h. Data from one of two independent experiments are shown. (C) Germ-free Swiss-Webster mice were gavaged 6 times over 14 days with doses of 1010 CFU of HA107, and after a further 14 days their germ-free status was confirmed by bacterial culture from feces and intestinal contents and culture-independent bacterial staining (2). n.d., not detected by enrichment culture from cecal or fecal material (<101 CFU). Data from n=4 mice from one of 7 independent experiments are shown. (D-F) Germ-free Swiss-Webster mice were gavaged 6 times over 2 weeks (1010 CFU per dose, panel E, “HA107”, n=4) or colonized with a sentinel colonized mouse containing an E. coli-free altered Schaedler flora (panel F, “ASF”, n=3) and compared to age-matched germ-free controls (panel D, “GF”, n=3). Sections of duodenum were stained with a FITC-mouse-IgA antibody (green) and DAPI (blue) as a nuclear counterstain. Insets indicate numbers of IgA plasma cells per intestinal villus (mean ± S.D.). (G-J) Live bacterial flow cytometric analysis of IgA-bacterial binding using IgA-containing intestinal washes from the mice depicted in D-F (see fig. S3 for technical details). Blue squares, HA107 gavaged mice (HA107); red triangles, ASF sentinel colonized mice (ASF); black circles, germ-free control mice (GF). Images and curves in panels D-J represent individual mice from one of 7 independent experiments.

