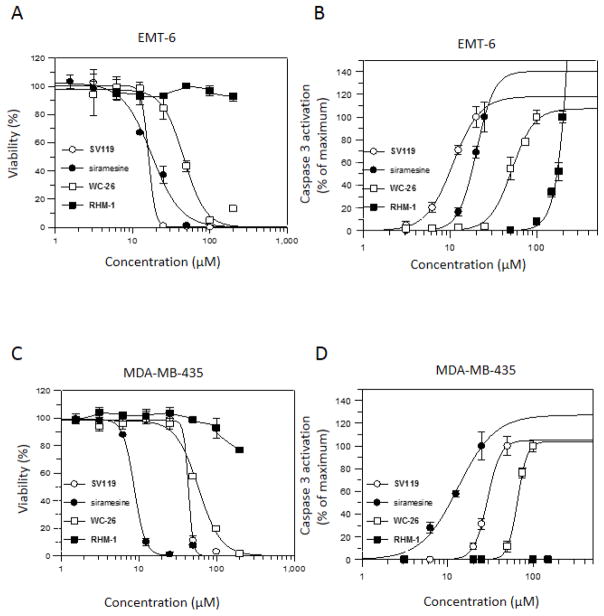
Fig. 2.
The dose response curves of the sigma-2 ligands in cell viability assay and caspase-3 activation assay. EMT-6 cells (A and B) or MDA-MB-435 cells (C and D) were treated with increasing concentrations of SV119 (○), siramesine (●), WC-26 (□), or RHM-1 (■) for 24 h. The cell viability and caspase-3 activation were then determined by MTS assay (A and C) and caspase-3 assay (B and D), respectively. The bars represent mean ± SD in the representative experiment performed in triplicates.

