
Figure 3.
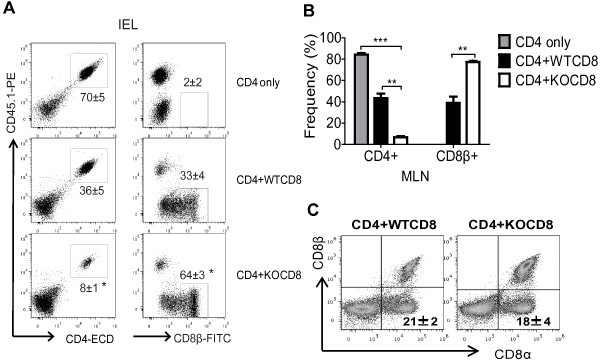
Frequencies of CD4+ and CD8+ T cells following CD4/CD8 co-transfer. (A) Dot plots show the frequencies of the reconstituted CD4/CD45.1+ and CD8β/CD45.1− T cells in the IEL at week 7 post-transfer for CD4 only, CD4 + WTCD8 and CD4 + KOCD8 Rag KO recipients (mice in Figure 2). (B) Bar charts showing the frequency of the reconstituted CD4/CD45.1+ and CD8β/CD45.1− T cells in the MLN. (C) Dot plots showing the frequency of T cells in the Rag KO recipients that expressed CD8αα in the IEL. Data is from n = 6-8 mice per group and the values represent the mean of three independent experiments ± SEM. ANOVA (A, B), or Student’s t-test (C), *P < 0.05, **P < 0.01, ***P < 0.001.