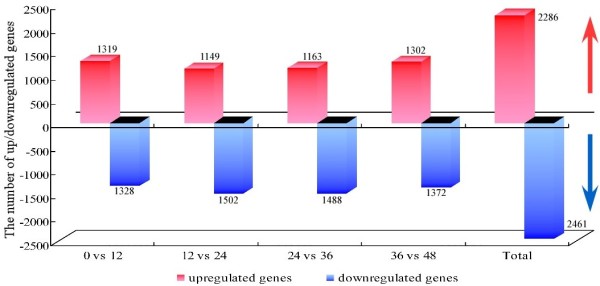
Figure 2.

The number of up/downregulated genes during five seed germination stages. Each group consists of a red column (the number of upregulated genes) and blue column (the number of downregulated genes). The numeral over the column is the number of up/downregulated genes. The former four groups are the number of genes between successive time points, and the last group is the total number of genes during the seed germination process.
