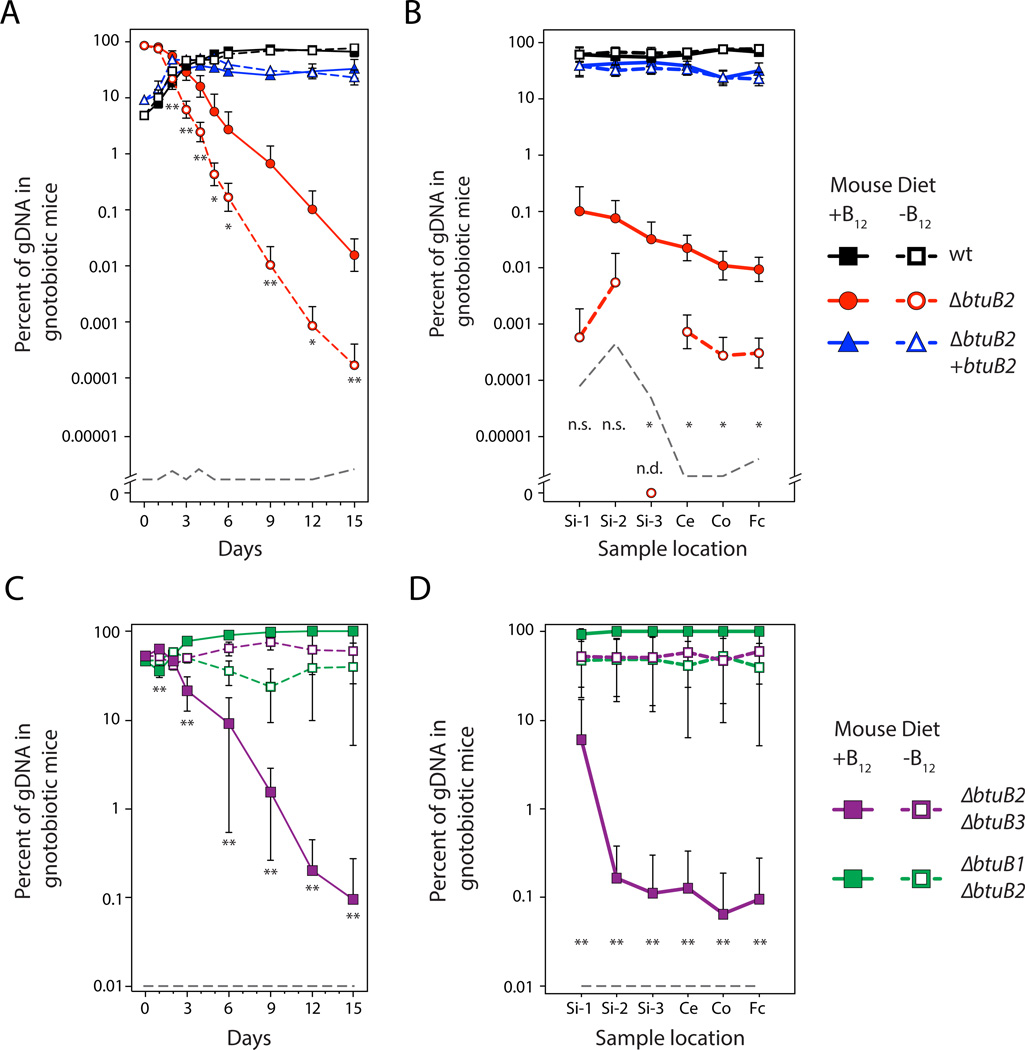
Figure 4. Functional specificity of homologous transporters determines microbial fitness in the mammalian gut.
Population dynamics of B. thetaiotaomicron wild type (black squares), ΔbtuB2 mutant (red circles), and complemented mutant strains (blue triangles) in gnotobiotic Swiss Webster mice are shown (A) in fecal samples over time (n=10/group) and (B) along the gastrointestinal tract (n=5/group). Strain abundances during in vivo competition between B. thetaiotaomicron strains encoding only BtuB1 (purple squares) or BtuB3 (green squares) in gnotobiotic Swiss Webster mice are shown over time (C) and along the length of the gut (D) (n=9/group). Asterisks indicate significant differences in ΔbtuB2 (A and B) or ΔbtuB2 ΔbtuB3 (C and D) mutant abundances in mice consuming a B12-replete diet (closed symbols and solid lines) compared to mice consuming a B12-deplete diet (open symbols and dashed lines; t-test * p < 0.05, ** p < 0.01). The limit of detection is shown with a dashed grey line; n.s., not significant; n.d., not detected. Genomic DNA was extracted and qPCR performed on the luminal contents of the proximal (Si-1), medial (Si-2) and distal (Si-3) small intestine, the cecum (Ce), colon (Co) and feces (Fc). See also Figure S4.

