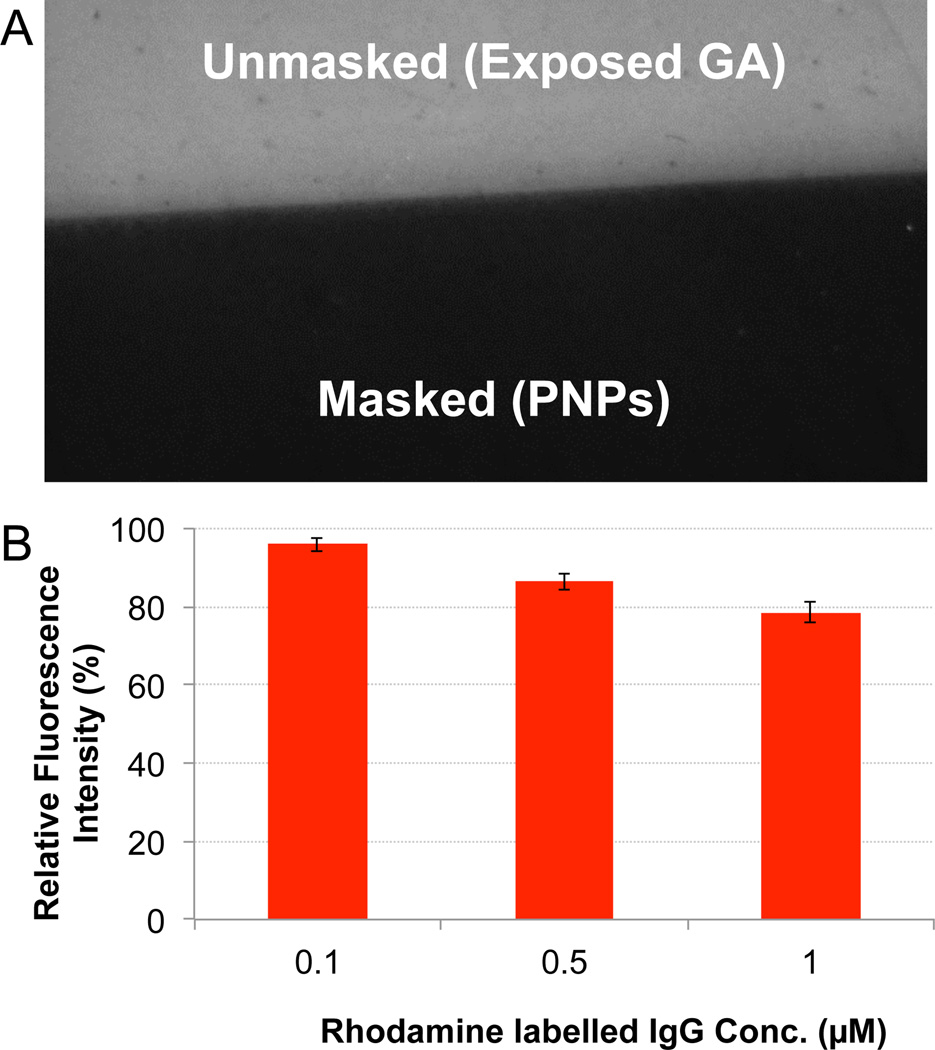
Figure 4.
(A) Fluorescence image taken at l0x magnification (2 sec. exposure) of 0.1 µM. r-IgG incubated on a protein reactive (glutaraldehyde) substrate which was partially covered with a PNP mask. (B) Relative fluorescence intensities of the PNP masked surface for different concentrations of r-IgG was calculated by normalizing the ratio of the fluorescence intensities of the masked to the unmasked regions. Error bars for each condition are calculated from the standard deviations of the fluorescence intensities. See methods section for detailed formulae.

