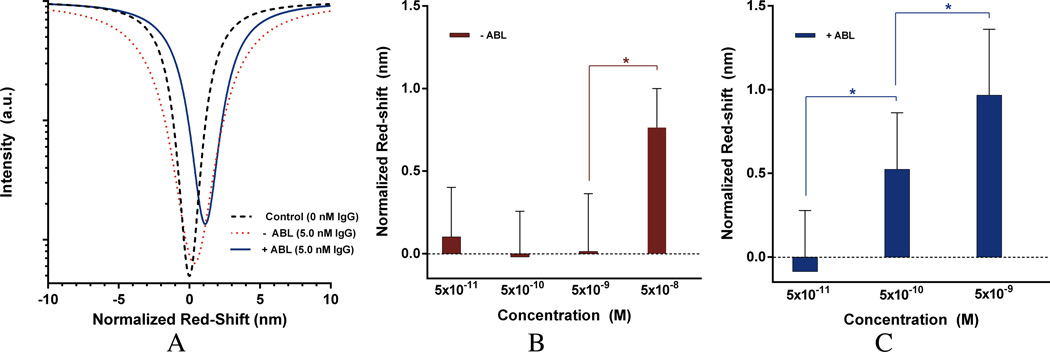
Figure 6.
Post-processed experimental peak shifts for two representative 2D-PhC sensors (A) which were incubated with capture antibody and set to zero red-shift (black dashed line); peak-shifts after incubation with 5 nM target without ABL (red dotted line) and with ABL (solid blue line). (B) and (C) Dose-response of a matched set of sensors without ABL (B, red bar) and with ABL (C, blue bar). Exposure of a second matched set of sensors with ABL to 50 nM target produced a similar red-shift (Supplementary Figure S2). Values that were statistically significant (unpaired 2-tailed student t-test, p-value < 0.05) were marked with an asterisk (*).Error bars were calculated by taking the square root of the sum of the control standard deviation squared plus the experimental standard deviation squared.

