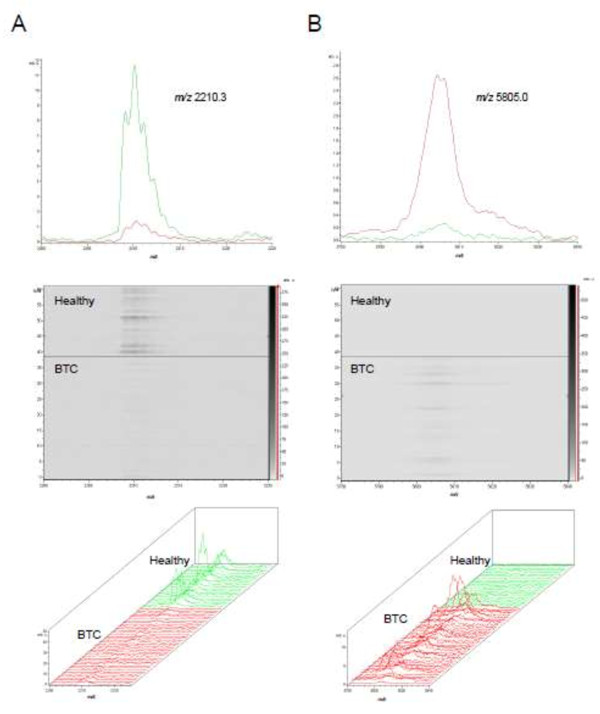
Figure 3.
Average spectra, gel and 3D spectral views for two significant peaks discriminating BTC (red) and healthy control (green) samples. A. The peak at m/z 2212.3 was generally of lower intensity in BTC samples compared to healthy samples. B. The peak at m/z 5805.0 was generally of higher intensity in BTC samples compared to healthy samples.

