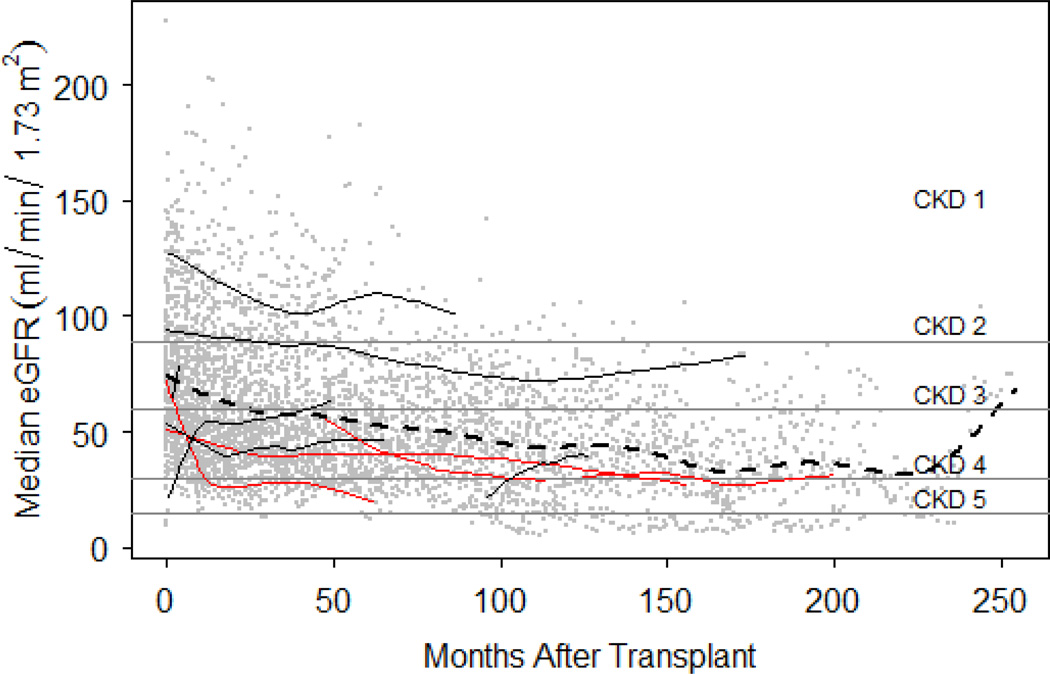
Figure 1. Post-transplant eGFR measurements plotted on the thresholds of the five stages of chronic kidney disease.
Individual post-transplant eGFR measurements are plotted on the y-axis against time in months after transplant on x-axis as grey dots. The dashed line represents a polynomial function fit to all eGFR measurements collected in the study. Ten randomly selected patient’s eGFR profiles have fitted with loess lines and colored in red if the patient developed Chronic Kidney Disease (CKD) Stage 4 or below. Thresholds for the 5 stages of CKD are indicated: CDK1 > 90, CKD2 60–89, CKD3 30–59, CKD4 15–29, and CKD5 < 15 mL/min/1.73m2.

