Figure 1.
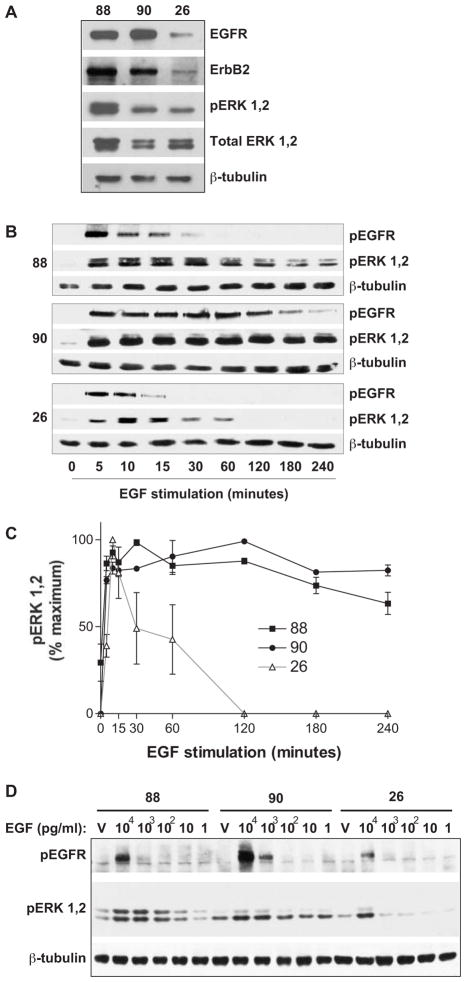
Characterization of protein expression and MPNST cell line response to EGF. (A) Total cell lysates from the ST88-14 (“88”), NF90-8 (“90”), and STS-26T (“26”) MPNST lines were analyzed by immunoblotting for antibodies versus total protein levels of EGFR and ErbB2, and active and total ERK. Expression of β-tubulin is shown for a loading control. (B) The MPNST cell lines were stimulated as shown with 10 ng/ml EGF. EGFR and ERK activation were assessed by immunoblotting with phospho-specific antibodies against each. Expression of β-tubulin is shown for a loading control. (C) Densitometry of the amount of active ERK1,2 in each sample in panel (B). Background was calculated from equivalent areas in each lane and subtracted from the value of protein in that lane. Active ERK1,2 levels were recorded as percent maximum signal, and are shown as mean ± S.E.M. from three independent experiments. (D) MPNST cells were treated for 10 min with the indicated pg/ml concentrations of EGF or vehicle (RPMI media, “V”) and the activation of EGFR and ERK determined by immunoblotting. β-tubulin is included as a protein loading control. Panels A, B and D are representative of at least three independent experiments.

