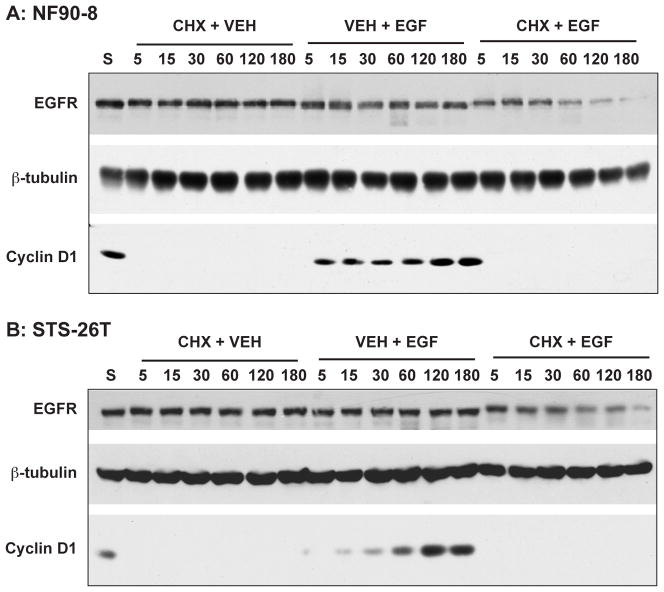
Figure 2.
Assessment of EGFR turnover in the MPNST cell lines. NF90-8 NF1 MPNST cells (A) and the non-NF1 MPNST line STS-26T (B) were pretreated with 50 μg/ml cycloheximide (or vehicle) for 2 h. Cells were then treated with 10 ng/ml EGF (or vehicle) for the indicated times. Lanes are indicated: “S”, untreated control; “CHX + VEH”, 2 h cycloheximide treatment followed by treatment with vehicle over the indicated time-course; “VEH + EGF”, pretreatment with ddH20 vehicle followed by treatment with 10 ng/ml EGF over the indicated time-course; “CHX + EGF”, 2 h treatment followed by treatment with 10 ng/ml EGF over the indicated time-course. Total EGFR protein levels were compared using immunoblotting. Cyclin-D1 is included to verify inhibition of EGF-stimulated protein synthesis by cycloheximide. β-tubulin is included as a protein loading control. These data are representative of at least three experiments per cell line.

