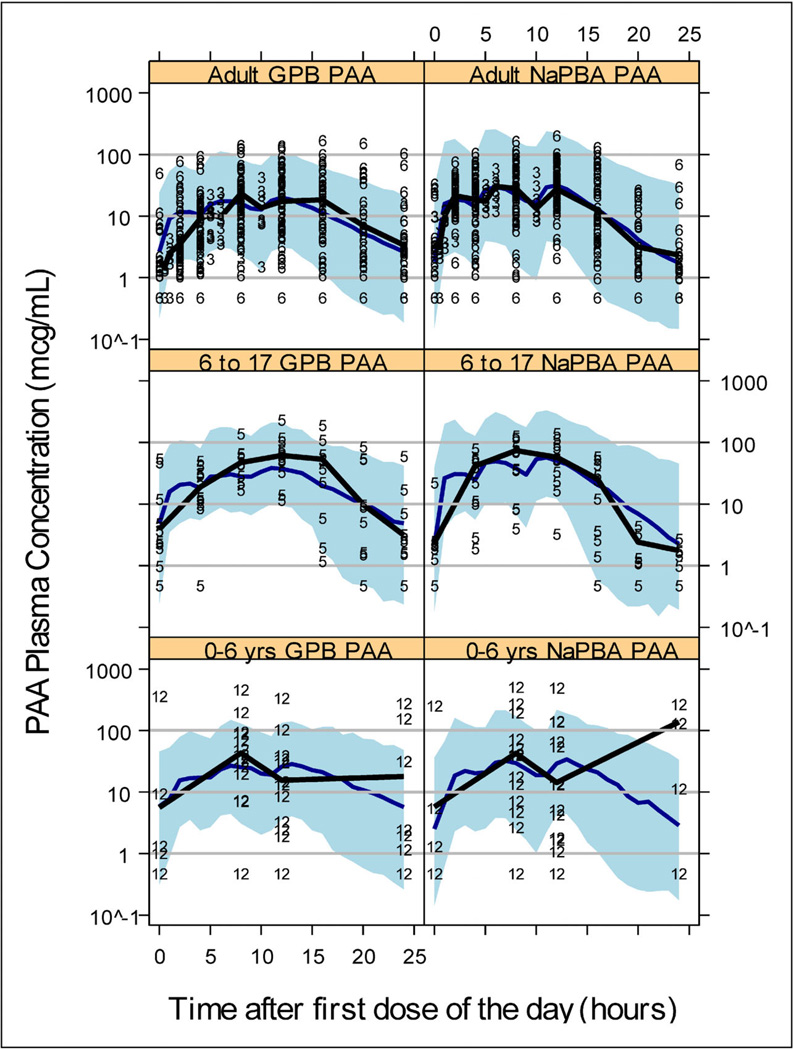
Figure 2.
Model qualification plots using visual predictive check for PAA and stratified by treatment and age group (0–6 years, 6–17 years, and adults). The symbols in the plots represent the study number from which the data were derived (3 = UP-1204-003, 5 = HPN-100-005, 6 = HPN-100-006, and 12 = HPN-100-012; see Table 1). The blue solid line is the VPC median profile and the thicker solid black line is the median profile from the study data contained in the respective plot. The shaded region represents the 90% prediction interval. LLOQ = 1 mcg/mL and symbols below LLOQ are presented as ½ LLOQ for display purposes.

