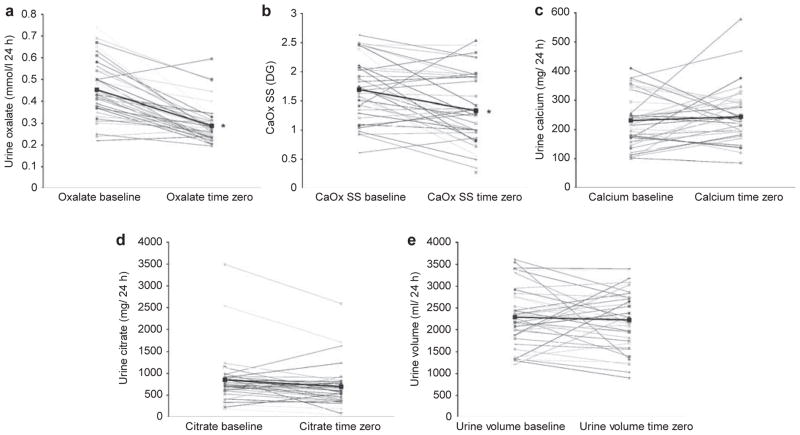
Figure 1.
Changes in urinary oxalate on a free-choice diet compared with a controlled metabolic low-oxalate diet. Urine oxalate (a) and CaOx SS (b) values fell on the controlled metabolic diet for the majority of subjects. Other key determinants of SS, including urinary calcium excretion (c), citrate excretion (d), and urine volume (e), did not change. *P<0.001 time zero versus baseline. CaOx, calcium oxalate; SS, supersaturation.

