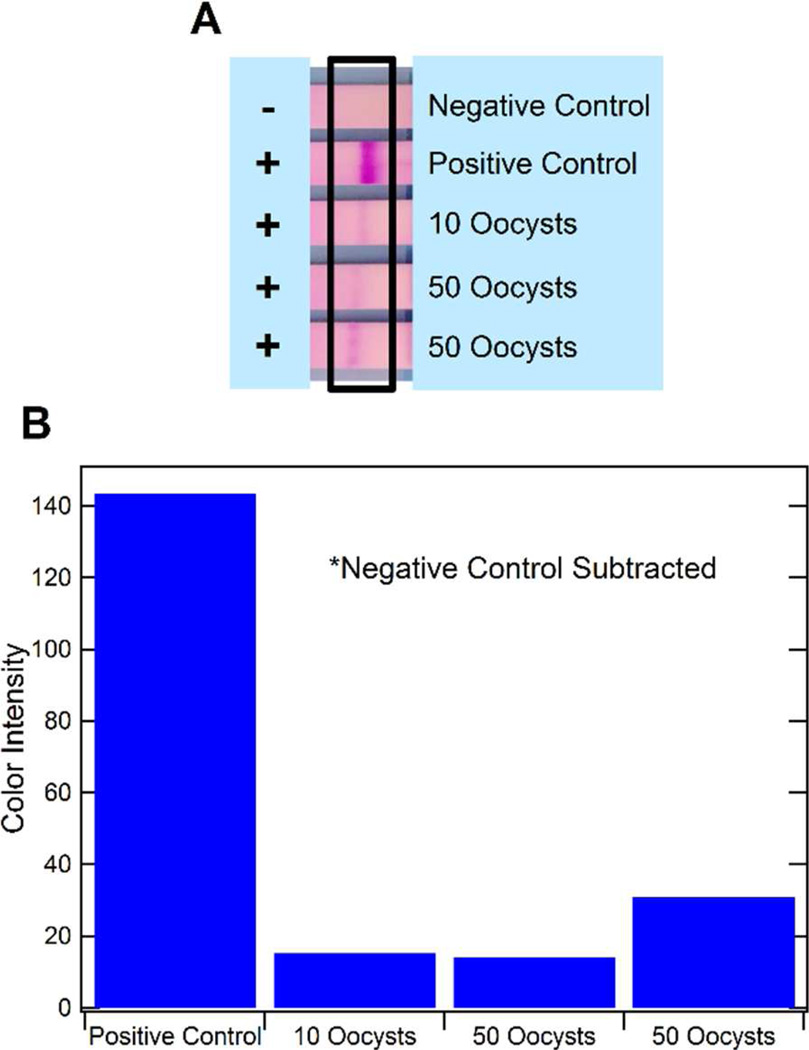
Figure 3.
Results from mRNA isolation within the microchannels and bench top NASBA. The results of on-chip isolation and off-chip NASBA for 10 and 50 C. parvum oocysts are shown by the LFA strips (A). An ImageJ quantification of the color intensity of the strips is also shown (B). The positive control is NASBA amplicon diluted by 108.

