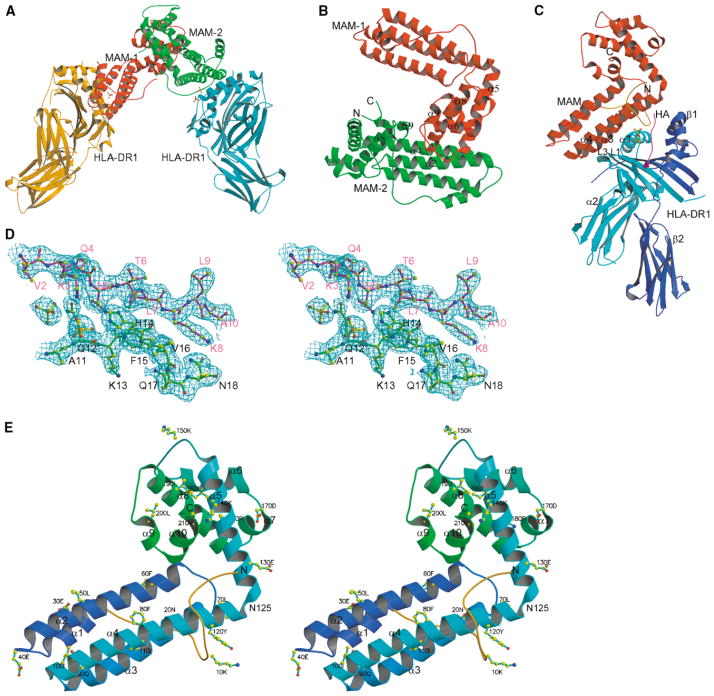
Figure 1. Overall Structure of the HLA-DR1/HA/MAM Complex.
(A) A dimerized MAM-MHC complex in the asymmetric unit. Two pairs of phosphate groups are shown in ball-and-stick representation at each complex interface.
(B) Ribbon diagram of MAM dimer. The N- and C termini of MAM-2 are labeled with N and C, respectively. The elements contributing to the dimer interface are labeled, including α5 (1), loop α5-α6 (2), α8 (4), and loop α8-α9 (3) from MAM-1, and α2 (7), α4 (2), α8 (2) and α9 (2) from MAM-2. The number in parentheses indicates the number of residues contributed to the dimer interface.
(C) A single HLA-DR1/HA/MAM complex, showing the overall geometry between HLA-DR1 and MAM. The α1, α2, β1, and β2 domains of HLA-DR1 are labeled. A pair of phosphate groups is shown in ball-and-stick representation at the interface. Each component is colored as follows: MAM, red; the DR1 α domain, cyan; the DR1 β domain, blue; the HA peptide, magenta. The N-terminal loop of MAM (1–25) is colored orange.
(D) Stereoview of a representative (2Fo-Fc) electron density map, contoured at 1.0 σ, at the complex interface, showing the HA peptide (magenta), MAM (green), phosphate groups (yellow). Here and in the following figures (unless otherwise specified), atoms are colored as follows: carbon, yellow; nitrogen, blue; oxygen, red; phosphate, green. Residues are labeled for the HA peptide (magenta) and MAM (black).
(E) Stereoview ribbon diagram of MAM monomer showing the overall fold and secondary structure elements of MAM with every tenth residue labeled. The ten α helices, including α1 (25–35), α2 (41–65), α3 (71–93), and α4 (96–125) from the N-terminal domain, and α5 (126–146), α6 (157–168), α7 (170–175), α8 (176–195), α9 (199–203), and α10 (204–211) from the C-terminal domain, are labeled. The N- and C termini are labeled as N and C, respectively. Asn125, which is shared by α4 and α5 helices and covalently connects the N- and C-terminal domains, is labeled. The N-terminal loop (1–25) is colored orange.

