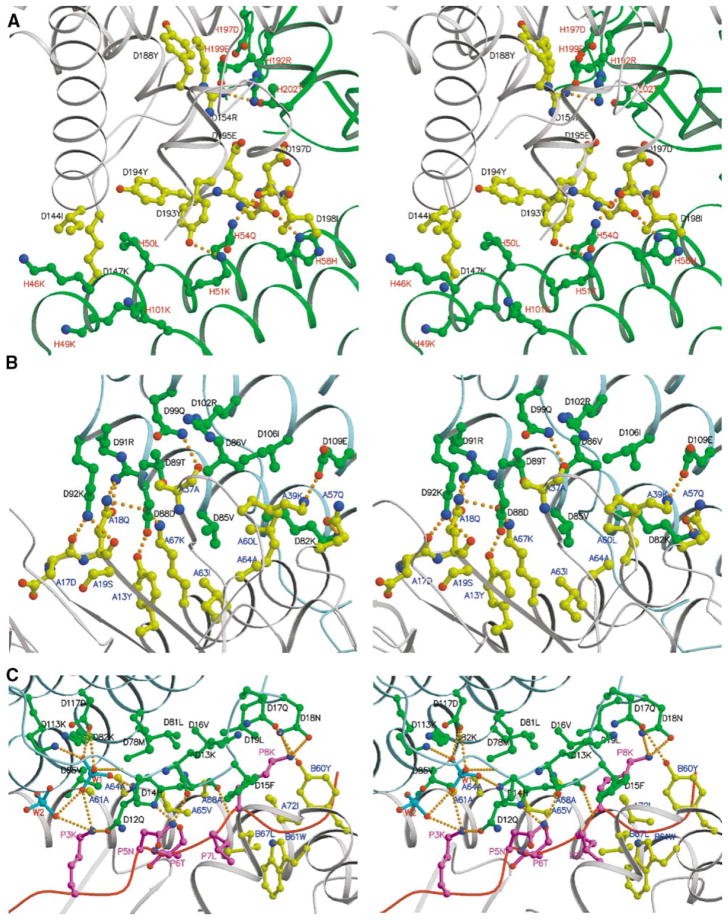
Figure 2. Details of MAM Dimer Interface and MAM/HA/DR1 Interface Shown as Stereoviews.
In all three panels, the letter before the residue number represents the chain name in the crystal structure.
(A) MAM homodimer interface. MAM-1 is colored gray, and MAM-2 is colored green. Key residues are depicted as ball-and-stick representations with bonds and carbon atoms colored as follows: MAM-1, yellow; MAM-2, green. Residues are color-labeled black and red for MAM-1 and MAM-2, respectively. The four hydrogen bonds, including Arg154 Nη2-Arg192 Nη1, Tyr193 Oη-Lys51 Nζ, Gly196 O-His58 Nδ1, and Asp197 O-Gln54 Nε2, are shown as orange dashed lines.
(B and C) Detailed views of HLA-DR1/HA/MAM interfaces, showing hydrogen bonds and hydrophobic interactions. The ribbon diagram of each component in the complex is colored as follows: MAM, light blue; peptide, magenta; HLA-DR1, gray. Key residues are displayed as ball-and-stick representations with bonds and carbon/phosphate atoms colored as follows: MAM, green; the HA peptide, magenta; HLA-DR1, yellow; PO43−, cyan. Hydrogen bonds are shown as orange dashed lines. Residues are color-labeled as follows: MAM, black; HLA-DR1, blue; peptide, magenta; phosphate, red.

