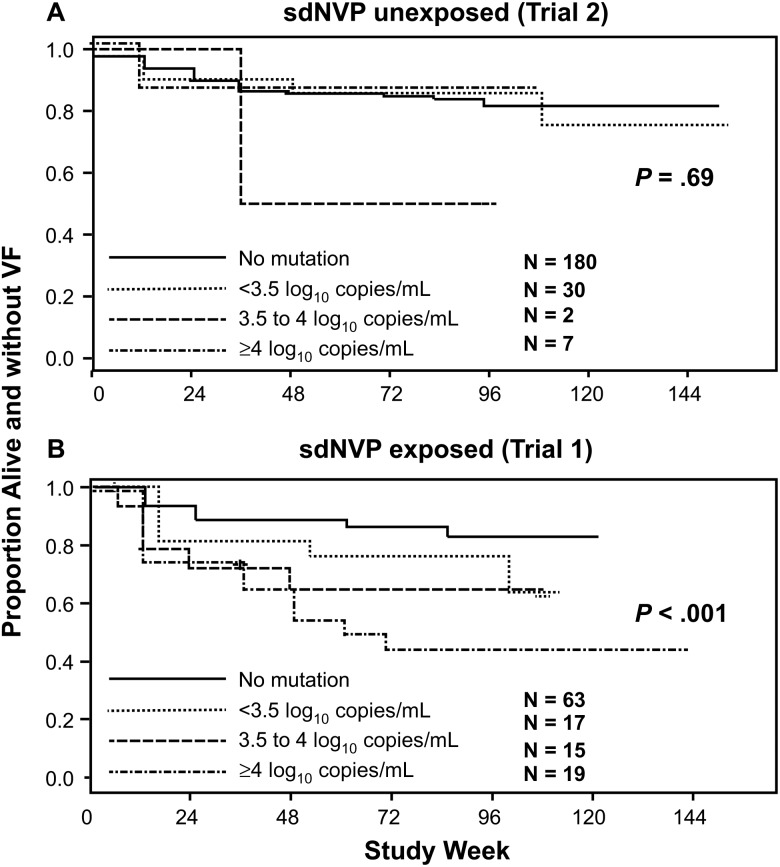
Figure 2.
Kaplan-Meier plots showing the proportion of women in trial 2 (A, women without single-dose nevirapine [sdNVP] exposure) and trial 1 (B, women with sdNVP exposure) alive and without virologic failure (VF) in each of 3 categories of mutant copy number detected at entry compared to women with no mutations detected. P values from proportional hazards models.

