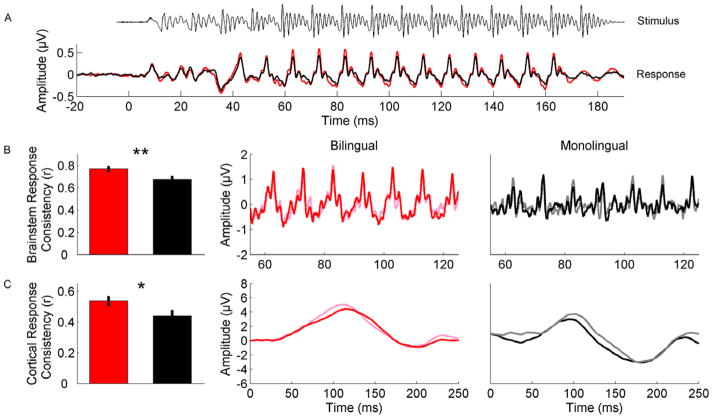
Figure 1.
Differences in evoked response consistency between bilinguals and monolinguals. (A) shows the grand average monolingual (black) and bilingual (red) brainstem responses to the speech stimulus [da], which has been time shifted to align with the response onset. (B) Brainstem and (C) cortical responses to the syllable [da] show greater consistency over the course of the testing session for bilinguals relative to monolinguals as evidenced by greater overlap between the pink (average of first half of responses) and red (average of last half of responses) compared to gray (average of first half of responses) and black (average of last half of responses). Brainstem responses in B have been zoomed in to illustrate differences in evoked response consistency to the vowel [a] portion of [da]. Waveforms in B and C are from representative subjects.

