FIGURE 2:
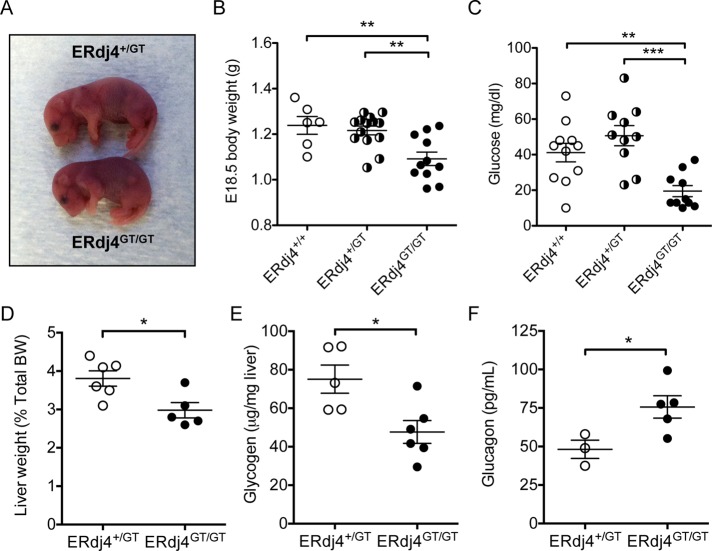
Fetal growth retardation and neonatal hypoglycemia in ERdj4GT/GT mice. (A) Size comparison of E18.5 embryos. (B) Body weights of E18.5 embryos. n = 6–14 mice/genotype. (C) Blood glucose levels of vaginally born or cesarean-delivered, nonsuckling neonates. n = 10–11 mice/genotype. (D) Liver weights of neonatal mice. BW, body weight. n = 5–6 mice/genotype. (E) Liver glycogen in neonatal mice. n = 5–6 mice/genotype. (F) Plasma glucagon in neonatal mice. n = 3–5 mice/genotype.

