
FIGURE 4:
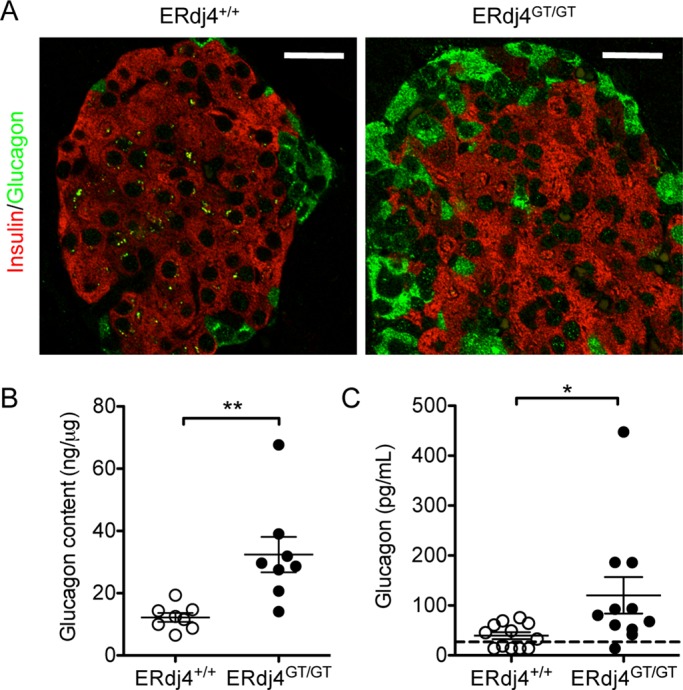
Pancreatic α cell hyperplasia and hyperglucagonemia in ERdj4GT/GT mice. (A) Immunofluorescence of insulin (red) and glucagon (green) in pancreatic tissue sections from 16- to 20-wk-old mice. Scale bars, 10 μm. n = 5 mice/genotype. (B) Glucagon protein in pancreatic extracts of 16- to 20-wk-old mice. n = 8 mice/genotype. (C) Plasma glucagon levels in fasted 8- to 16-wk-old mice. n = 11–12 mice/genotype.