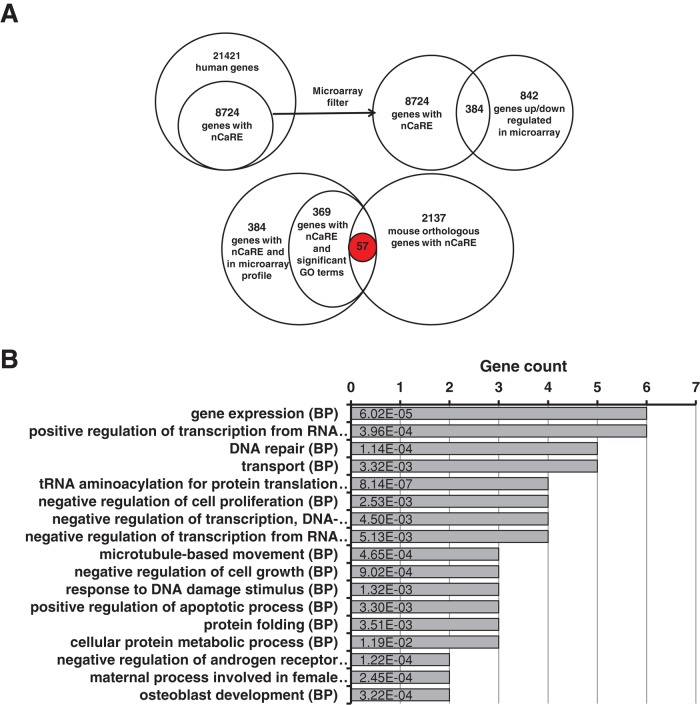
FIGURE 1:
Bioinformatic research on nCaRE sequences. (A) Results obtained from the application of the different filters. Top, data derived from alignment research on nCaRE sequences on human gene promoters and subsequent cross-checking with microarray data. Bottom, final results from combined GO and phylogenetic footprinting analyses. (B) Functional enrichment analysis of the 57 putative genes regulated by APE1 performed according to their biological process annotations. For simplicity, only the most representative functional categories are reported. The number of genes for each category is provided on the horizontal axis, together with the list of the first 17 co-occurrence terms. Statistical significance for each category is shown within each bar.

