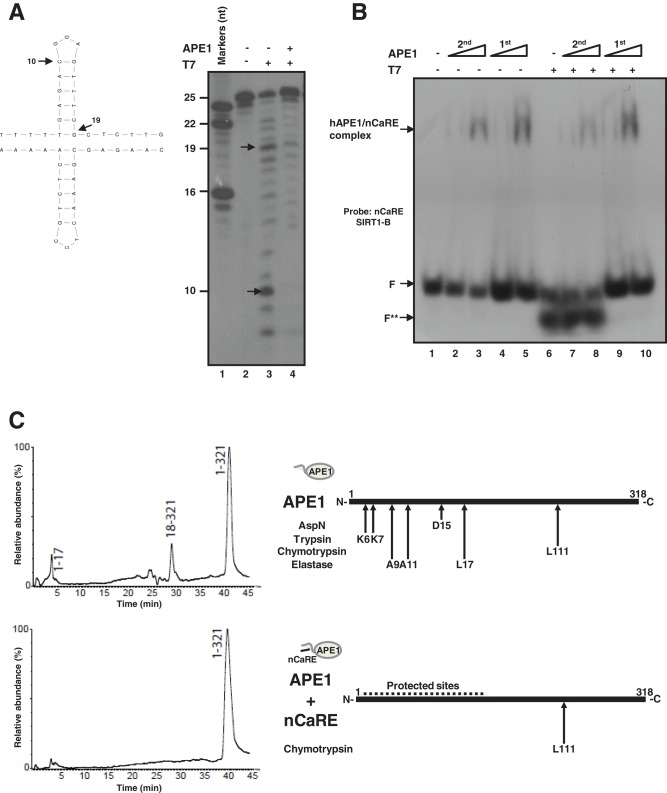
FIGURE 3:
APE1 recognizes structured nCaRE sequences through its N-terminal domain. (A) Left, predicted cruciform structure of nCaRE SIRT1-B ds oligonucleotide. Arrows indicate the cleavage site of T7 endonuclease I and the length of the products. Right, 5′-32P-end-labeled nCaRE was preincubated (lane 4) or not (lane 3) with APE1 recombinant protein and then subject to T7 endonuclease digestion. (B) EMSA analysis of APE1 binding to nCaRE sequence after digestion with T7 endonuclease (lanes 7 and 8) or upon preincubation with APE1 and subsequent digestion with T7 endonuclease (lanes 9 and 10). Lane 1 is the probe alone; APE1 incubation with the probe was performed temporally before (1st) or after (2nd) T7 digestion; F shows the position of the free oligonucleotide probe. F** indicates the T7 endonuclease–digested probe. Specific APE1/nCaRE interaction is indicated by the arrow. (C) Schematic representation of the amino acids within the N-terminal domain of APE1 and involved in nCaRE oligonucleotide binding. Left, proteolytic maps obtained after incubation of recombinant APE1 alone (top) or recombinant APE1 complexed with SIRT1 nCaRE-B oligonucleotide (bottom) with endoprotease AspN. Experiments were performed on a recombinant APE1 form bearing three additional amino acids at the protein N-terminus with respect to the native counterpart. Peptides identified by mass spectrometry analysis are indicated at the top of the corresponding chromatographic peaks. Right, proteolytic sites identified in native APE1 alone (top) and in APE1 complexed with SIRT1 nCaRE-B oligonucleotide (bottom); summary of results from independent experiments performed by using different proteases. See the Supplemental Information for experimental details and Supplemental Figure S4 and Supplemental Table S4 for complete data.

