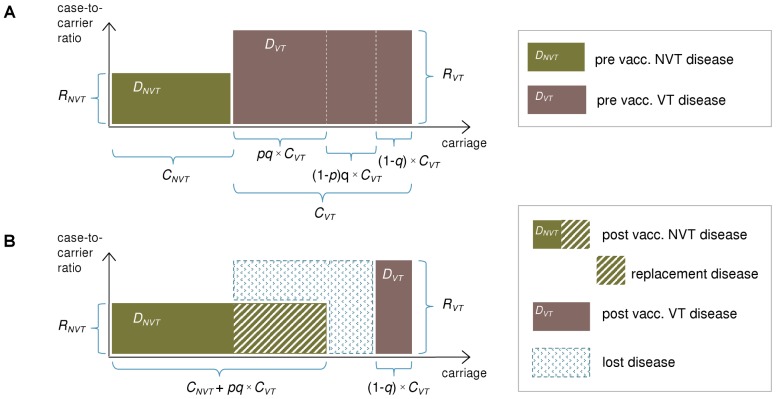
Figure 1. Illustration of the replacement model.
The incidence of pneumococcal carriage (x-axis) and case-to-carrier ratios (y-axis) for vaccine serotypes (VT) and non-vaccine serotypes (NVT) before (panel A) and after vaccination (panel B). The incidences of disease (DNVT and DVT) are obtained by multiplication of the two quantities and correspond to the areas of the rectangles. VT carriage is divided into 3 segments corresponding to different effects of vaccination on population-level carriage: (i) VT elimination with replacement (proportion pq of VT carriage); (ii) VT elimination without replacement (proportion (1-p)q of VT carriage; and (iii) non-elimination (proportion (1-q) of VT carriage). Here q is the proportion of VT carriage eliminated by vaccination and p is the proportion of eliminated VT carriage replaced by NVT carriage. For notation, see text. The decrease in IPD incidence after vaccination is obtained as the difference between the eliminated VT disease and the replacing NVT disease. This is the combined area of the blue rectangles in panel (B).

