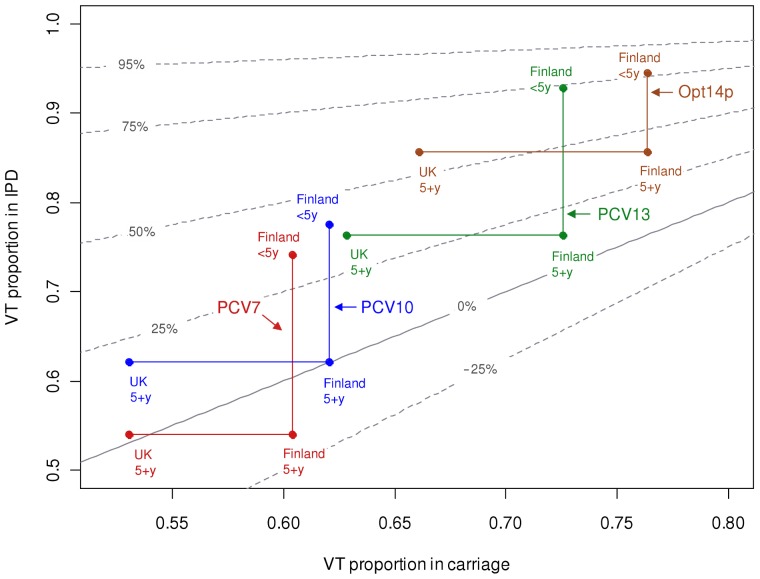
Figure 3. Predicted reduction in IPD incidence as a function of pre-vaccination proportions of VT carriage and disease.
Each curve (drawn in grey colour) corresponds to all possible combinations of the pre-vaccination proportions of VT carriage (x-axis) and VT disease (y-axis) that lead to the indicated level of reduction in IPD incidence (95, 75, 50, 25, 0 and −25%). The results are shown for complete replacement in carriage. The locations of 12 combinations regarding the VT carriage and VT disease proportions are superimposed. These combinations pertain to 4 different vaccine formulations (PCV7, PCV10, PCV13, Opt14p) and two age groups (<5 or 5+ year olds); for the older age group, two alternative carriage proportions are presented. In each case, the Finnish IPD data were used. The 14-valent vaccine composition Opt14p refers to a hypothetical vaccine discussed in Figure 5. Scenarios pertaining to the same vaccine composition but different carriage data for adults are connected by horizontal lines. Scenarios pertaining to the same carriage data but different age groups are joined by vertical lines. For results under partial replacement in carriage, see Figure S2.

