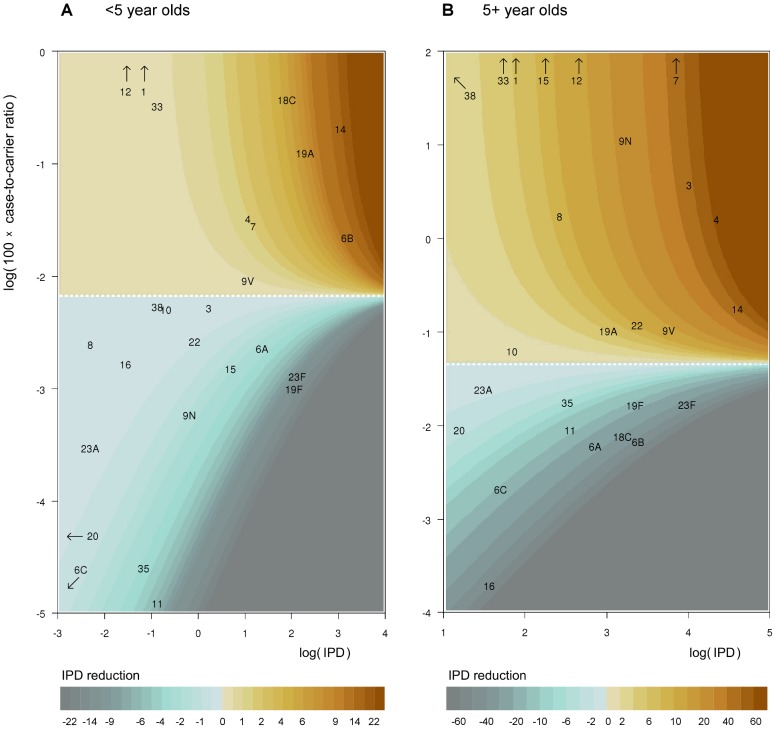
Figure 4. Effect on IPD of adding a single new vaccine type.
Contour plots of the effect of a single vaccine type as a function of serotype-specific IPD incidence (horizontal axis) and case-to-carrier ratio (CCR, vertical axis) under the complete replacement model. Panel (A) corresponds to children under 5 years of age and panel (B) to the rest of the population. The predicted decrease in annual IPD incidence from the IPD incidence under no vaccination (99 and 658 for <5 and 5+ year olds, among populations of size 300,000 and 5,000,000, respectively) is indicated by colour codes. Interpretation of the colour codes in terms of decrease in IPD incidence, separately for each panel, is shown below the panels. The horizontal white dashed line corresponds to no effect. The axes are in log scale. Serotypes outside of the range of the plot due to a high case-to-carrier ratio or a low IPD incidence are indicated by arrows.

