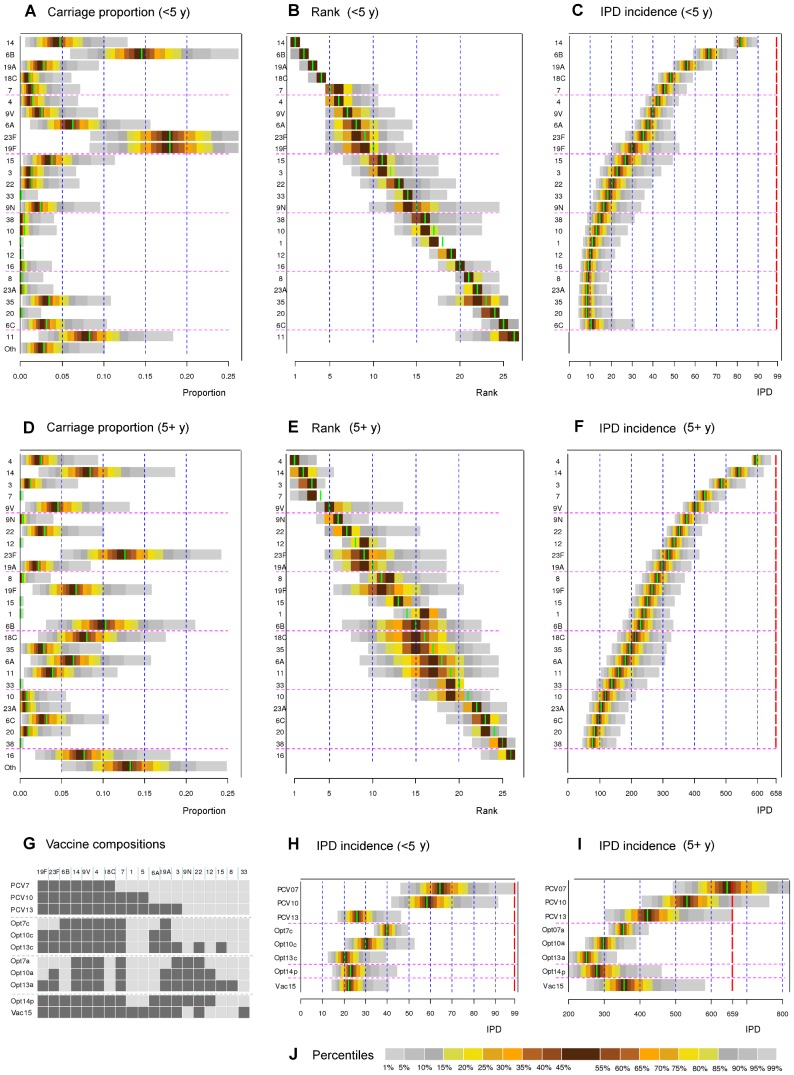
Figure 5. Optimal serotype compositions.
(A) The observed serotype-specific proportions in carriage among children <5 years old (Finland) with uncertainty distribution (see File S2). The colours indicate percentiles of the distribution as shown in panel J. In each panel, the green bar corresponds to the result obtained using the observed proportion in carriage (see Figure 2). (B) Serotypes in the order of importance in the vaccine composition (from top to bottom) for children <5 years old. The order is based on sequentially adding a new serotype to the current composition so that the new serotype corresponds to the highest IPD reduction. In addition, uncertainty about each serotype's rank in the sequence is shown, based on the uncertainty in carriage data. As the ranks are integer numbers, some percentage points of the distributions are not shown. (C) Annual IPD incidence in <5 year olds (population of size 300,000) in Finland, corresponding to each sequential step. For example, the third horizontal bar for the <5 year olds means that adding serotype 19A to a bivalent vaccine with serotypes 14 and 6B is expected to lead to 57 annual IPD cases. The uncertainty in IPD predictions induced by uncertainty in the carriage data is shown. The dashed red line on the right corresponds to the annual IPD incidence under no vaccination (99). (D),(E),(F) As panels A–C, but for the population 5+ years of age (population size 5,000,000). The no vaccination IPD incidence is 658. (G) List of the 11 different vaccine compositions of interest: PCV7, PCV10, PCV13; the optimal (hypothetical) 7, 10 and 13-valent vaccines: Opt7c, Opt10c and Opt13c for <5 year of olds; Opt7a, Opt10a and Opt13a for 5+ years olds. In addition, Opt14p refers to a (hypothetical) vaccine composition optimised for the whole population and Vac15 to a possible future composition [22]. Dark square indicates inclusion in the corresponding vaccine composition. (H),(I) The projected IPD incidences for the vaccine compositions in panel G corresponding to perturbations of the serotype proportions as shown in panels A and D. (J) Colour codes corresponding to the percentiles of the distributions. For optimal serotype compositions under partial replacement in carriage, see Figure S3.

