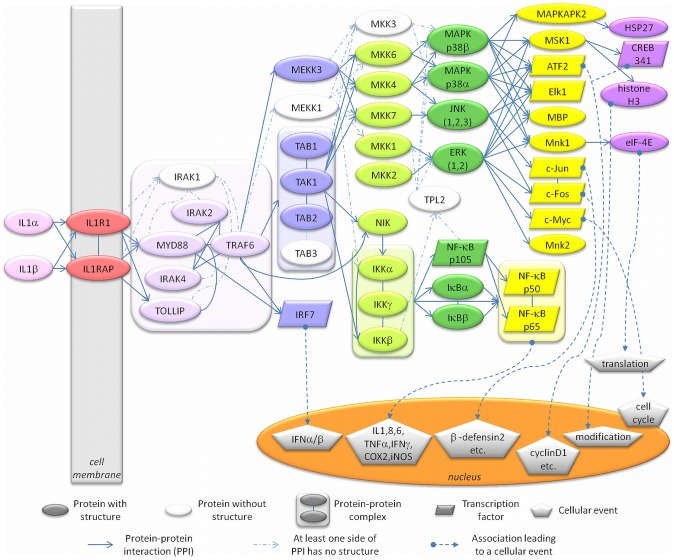
Figure 2. IL-1 signaling pathway reconstructed by combining related pathways and information from the literature.
This detailed map of IL-1 signaling presents the protein-protein interactions and the resulting cellular events. The colored nodes represent proteins having experimentally identified 3D structures and the white nodes are the proteins without 3D structures. The edges represent protein-protein interactions (straight/dashed arrows relate to available/unavailable 3D structures of proteins) or associations leading to cellular events such as cell cycle or gene expression (dashed arrows beginning with circular heads).

